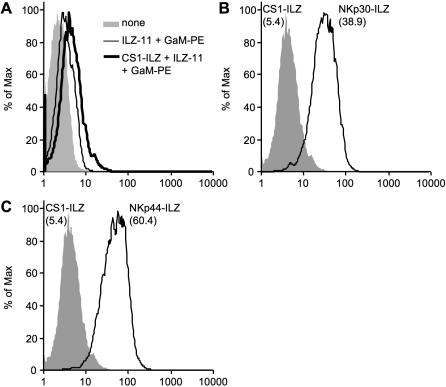
Figure 2. Detection of NKp30L and NKp44L on the surface of cells by FACS analysis.
(A) 293T cells were analyzed without treatment (none) or after incubation with medium or CS1-ILZ, followed by anti-ILZ mAb (ILZ-11) and PE-labeled goat anti-mouse IgG (GaM-PE) staining. (B, C) 293T cells were stained with CS1-ILZ, NKp30-ILZ (B) or NKp44-ILZ (C) as described in (A) and analyzed by FACS. Mean fluorescence intensities of the stainings are indicated in brackets.

