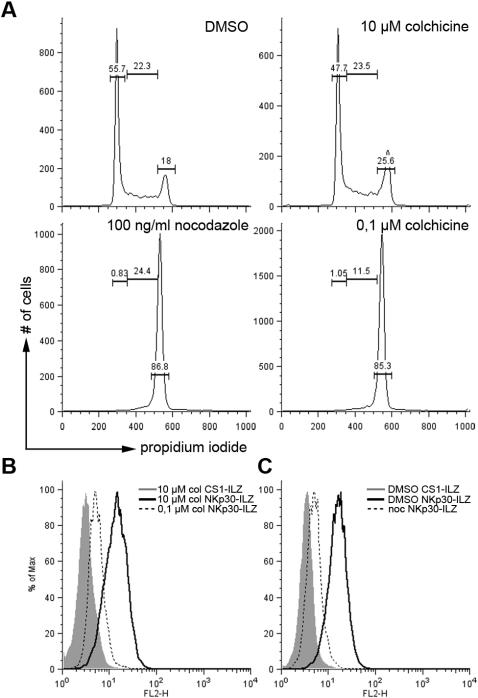
Figure 5. Reduced expression of NKp30L in cells arrested in mitosis.
(A) 293T cells were treated with DMSO for 18 hours, 10 µM colchicine (col) for 1 hour, 100 ng/ml nocodazole (noc) or 0.1 µM colchicine for 18 hours and the cell cycle stage of the treated cells was analyzed by FACS. Numbers represent percentage of cells in G1 phase (left) S phase (middle) and G2/M phase (right). (B and C) the same cells as in (A) were analyzed for the expression of NKp30L as described in Fig. 2.

