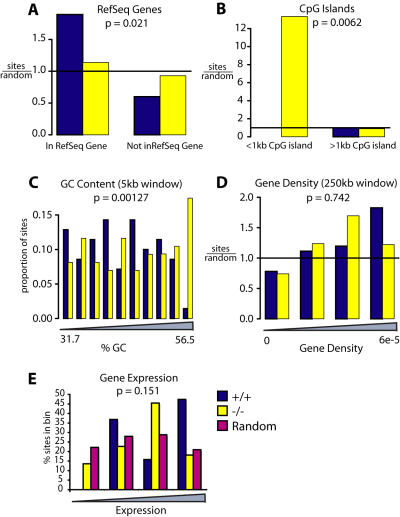
Figure 7. EIAV integration distributions in murine control and LEDGF/p75-disrupted cells.
Integration frequencies are shown relative to A) RefSeq genes, B) CpG islands (1 kb window; note that there were no control sites within <1 kb), C) G/C content, D) Gene density (250 kb window), E) Gene activity. Markings as in Figure 4.

