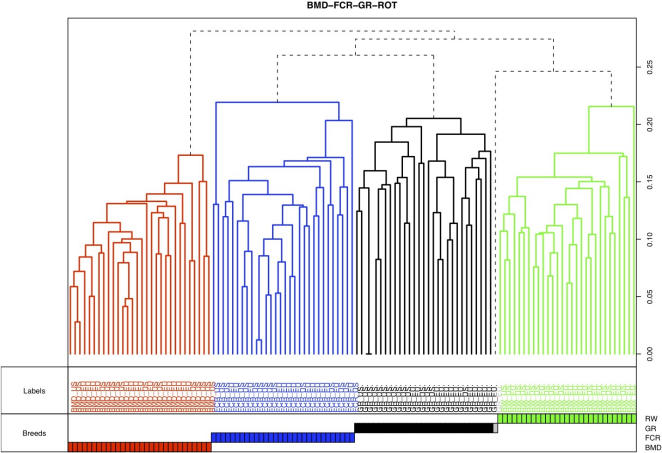
Figure 1. Hierarchical clustering between the four breeds.
Clustering of the 119 dogs (k = 4) from the four different breeds. In the dendogram each vertical line represents a single dog and the color reflects the four clusters obtained by PLINK analysis. A grey dashed line indicates an outlier dog. Below the dendogram, dogs are named by their breed origin, and names are colored upon their cluster assignment. At the bottom of the figure, colored squares are drawn on four lines, each line representing the different breeds. The scale on the right axis represents the genetics distances calculated by PLINK software. Each breed separates from the others as the four colors correspond exactly to the four breeds, red for BMD, blue for FCR, black for GR and green for ROT.

