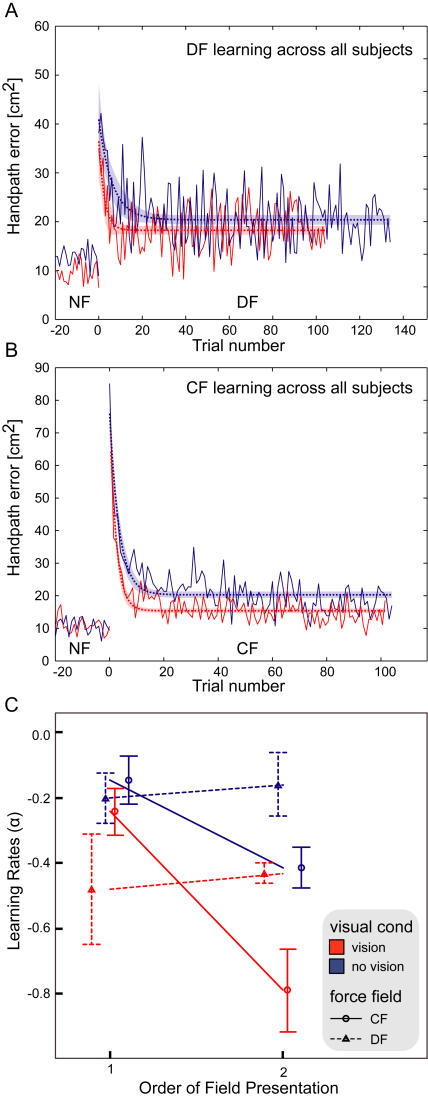
Figure 3. Mean learning represented by absolute hand-path error averaged across all subjects.
(A) Mean learning in the divergent force field (DF) is shown using thick solid lines. Learning with vision is shown in red, while learning with no vision of the endpoint position is shown in blue. The thin dotted line and shaded region illustrates the least-squares fitted exponential curves with 95% confidence intervals. Data occurring before 0 trials was performed in the null force field (NF) colored according to the visual conditions as above. (B) Mean learning in the curl force field (CF). (C) A comparison of learning rates (α) across the conditions plotted against the order of subject performance. The learning rate was estimated for each subject in each condition separately using equation (4). Red and blue lines indicate the vision and no-vision conditions respectively. The DF field is plotted with dotted lines whereas the CF field is plotted with solid lines. Order = 1 indicates that this condition (vision or no-vision) was performed before learning the same field with the other visual condition, whereas order = 2 indicates the opposite. Error bars represent standard error of the mean.

