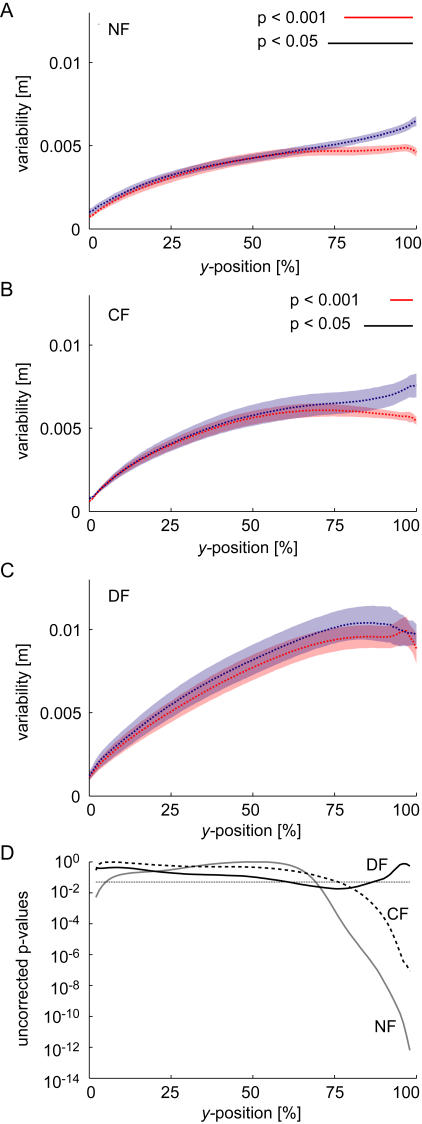
Figure 4. Mean movement variability in the x-direction as a function of the percentage of total movement distance in the y-direction shown for the final 20 trials of learning averaged across all subjects.
(A) For movements in the NF. The mean value (dotted line) plus mean standard error (shaded areas) are shown for both vision and no-vision conditions. While the variability is higher in the no-vision condition throughout the movement this becomes most prominent towards the end of the movement. Times with a significant difference between the visual and non-visual conditions are indicated by the black (p<0.05) and red (p<0.001) lines at the top of the figure (Bonferroni corrected for multiple comparisons). (B) Movements in the CF. The largest difference in the variability between the no-vision and vision conditions occurs at the end of the movement. (C) Movements in the DF. No significant differences were found. (D) Uncorrected p-values for the paired t-tests performed for each of the three force fields. The uncorrected p = 0.05 level is indicated with the thin dotted line.

