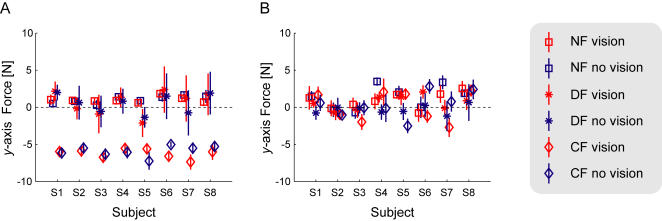
Figure 5. Endpoint Force exerted against the handle of the manipulandum after learning.
(A) The mean endpoint force in the x- axis across all eight subjects during the 50ms period in the middle of the movement over which the endpoint stiffness is estimated. The visual conditions are shown in red, and the non-visual conditions in blue. The NF is shown with the square, the DF with the asterisk, and the CF with the diamond. The error bars indicate the standard deviation of the force across the ten trials. (B) Mean y-axis endpoint force across the conditions for each subject.

