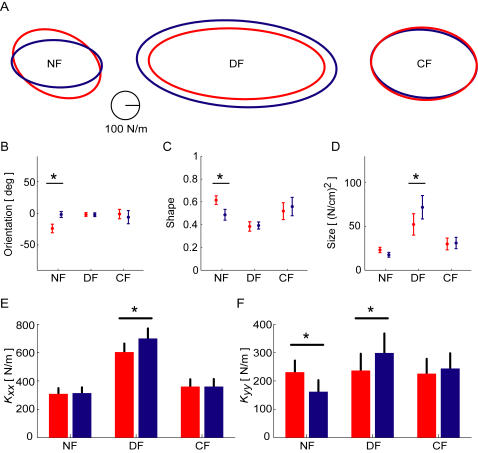
Figure 7. Changes in the endpoint stiffness after learning under the visual (red) and non-visual (blue) conditions.
(A) Ellipses averaged across all subjects for the NF, DF and CF. (B) The mean endpoint stiffness ellipse orientation across the six conditions. (C) The mean endpoint stiffness ellipse shape. (D) The mean endpoint stiffness size in the NF, DF and CF. (E) The mean Kxx stiffness in the NF, DF and CF. (F) The mean Kyy stiffness across the three conditions. The symbol * indicates that there is a significant difference at the p = 0.05 level. For all figures, error bars represent the standard error of the mean.

