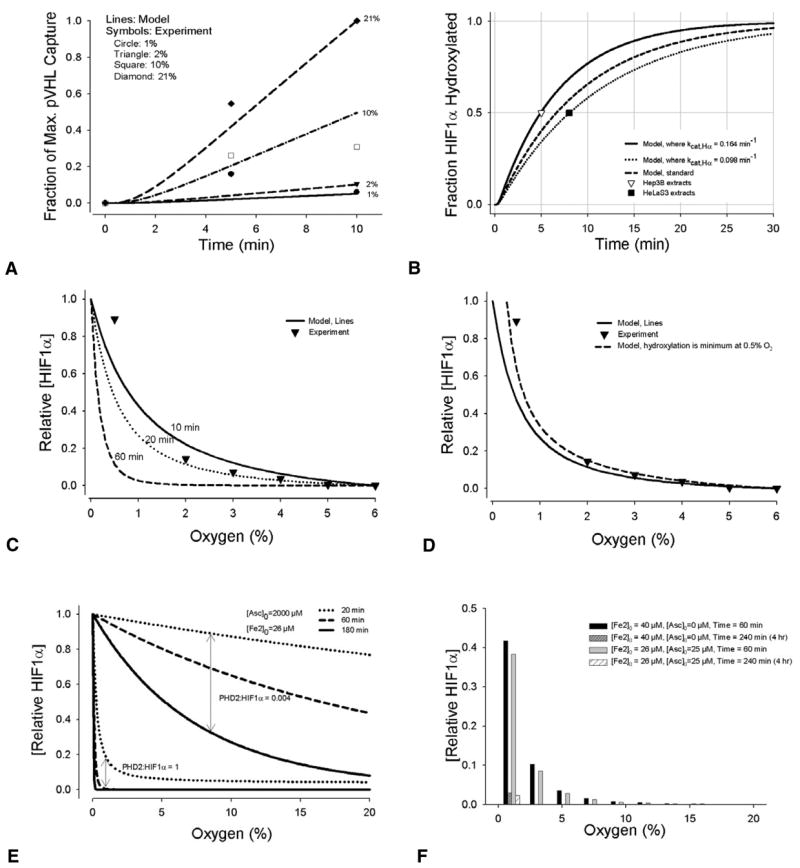
Fig. 3.

Model comparisons with experiments. (A) HIF1α hydroxylation by PHDs is related to cellular O2 levels (1, 2, 10 and 21%) in the model (lines). Results are compared with independent experimental data (Tuckerman et al., 2004), showing HIF1α modification by PHD2 measured by relative VHL capture at 0, 5 and 10 minutes (symbols). (B) Model predictions of the minimum percentage of HIF1α hydroxylated by PHD2 in normoxia (21% oxygen), lines. This is compared with experiments that measured HIF1α half-life in cells that were initially hypoxic, and at time zero in 20–21% oxygen; experimental values: t1/2=5–8 minutes (Berra et al., 2001; Jewell et al., 2001); t1/2<5 minutes (Huang et al., 1998). (C) Comparison of relative HIF1α accumulation predicted by the model at different oxygen levels with in vitro data (Jiang et al., 1996). Data points in Fig. 3C and 3D are the mean of two experiments. [O2]=0–59 μM in the model corresponds to ~0–6% in the experiment. Initial model conditions were default values (Table 1). 10, 20, and 60 minutes correspond to the duration of the hydroxylation reaction. Both the experimental data and model results were normalized to the value obtained at 6% O2 ([O2]=59 μM). (D) Comparison with the same experiment, using the time of 20 minutes in the model. A line is provided showing what the model would predict if the lowest hydroxylation rate was set at 0.5% O2 rather than 0% O2. Intranuclear hydroxylation during anoxia is one possible mechanism by which HIF1α nuclear levels decrease below 0.5%, as shown by Jiang et al (Jiang et al., 1996). The model currently does not account for additional changes during anoxia. The delay accounting for the time it takes unhydroxylated HIF1α in the cytoplasm to move into the nucleus is assumed constant across all O2 levels. (E) Model results for HIF1α expression with ascorbate supplementation. The effects of PHD2:HIF1α concentration ratios on HIF1α expression are shown. (F) Model results showing HIF1α expression with iron or ascorbate supplementation after 1 hour and 4 hours of normoxia.
