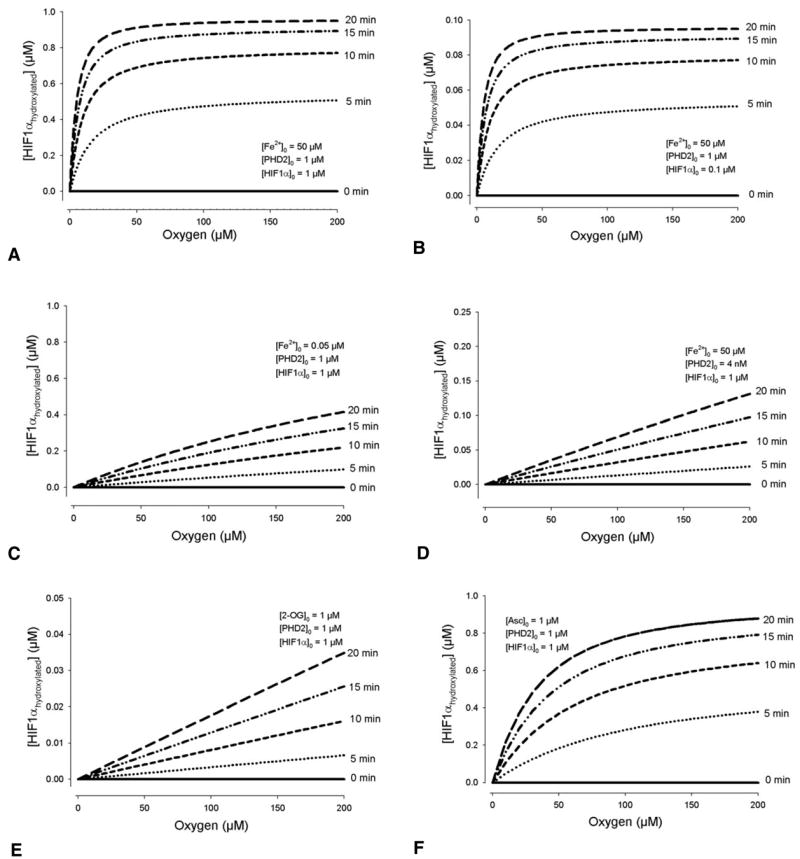
Fig. 4.

Model conditions where initial concentrations determine whether there is a switch-like response to O2 levels in the amount of HIF1α hydroxylated, or a gradual one. (A) When all enzymes are in excess, a steep drop in hydroxylation occurs as [O2] falls below 30 μM. For a range of initial unhydroxylated HIF1α between 0 and 1 μM, a steep, switch-like response is present. (B) An example with [HIF1α]0=0.1 μM. In comparison, when iron (C), PHD2 (D) or 2-oxoglutarate (E) is limiting, the hydroxylation shows no apparent switch-like behavior. (F) The effect of ascorbate is mixed. In A–E, [Asc]0=1000 μM, in excess. At low levels of the compound (below its Km for HIF1α, which is 180 μM), the oxygen response curve shows a more gradual, but non-linear reduction in hydroxylation. [Asc]0=1 μM is shown as an example.
