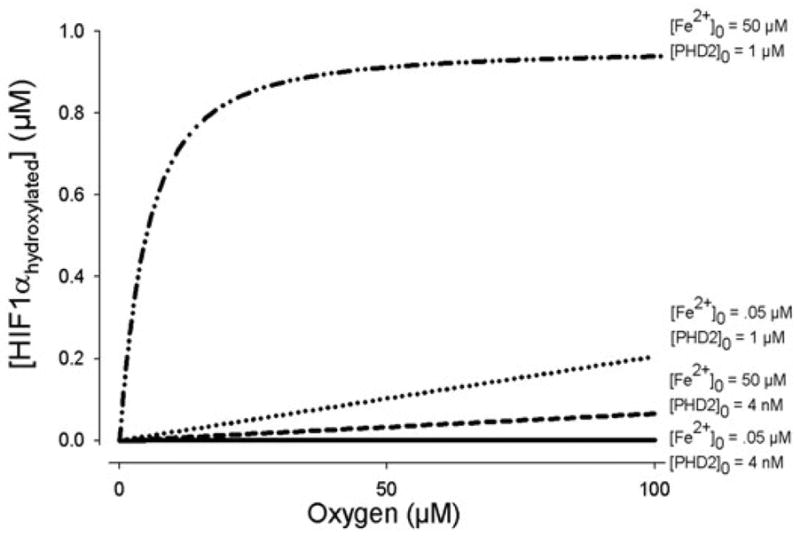
Fig. 5.

Comparisons of O2 response curves. When both PHD2 and Fe2+ are limiting reactants ([Fe2+]0=0.05, [PHD2]0=4 nM), the slope of the HIF1 hydroxylation curve (at 20 minutes) is significantly less than when either one of the compounds separately limit the reaction. These lines are compared with the oxygen response when all compounds are in excess. The effects of the changing sensitivity to oxygen are significant in hypoxia (below ~30 μM). For each line, [HIF1α]0=0.1 μM.
