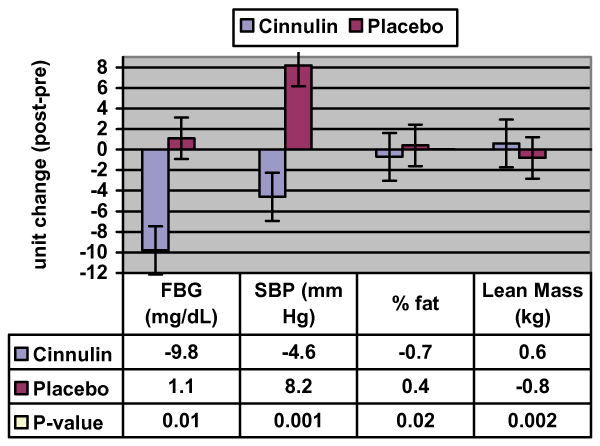
Figure 2.
Significant Changes in Primary Endpoints During the Study. Data are expressed as change scores (week 12 – week 0). Values represent group means ± SE. P-values were calculated from repeated measures (group × time) ANOVA, except for % fat where a dependent t-test was used following a marginally significant (P < 0.06) interaction term.

