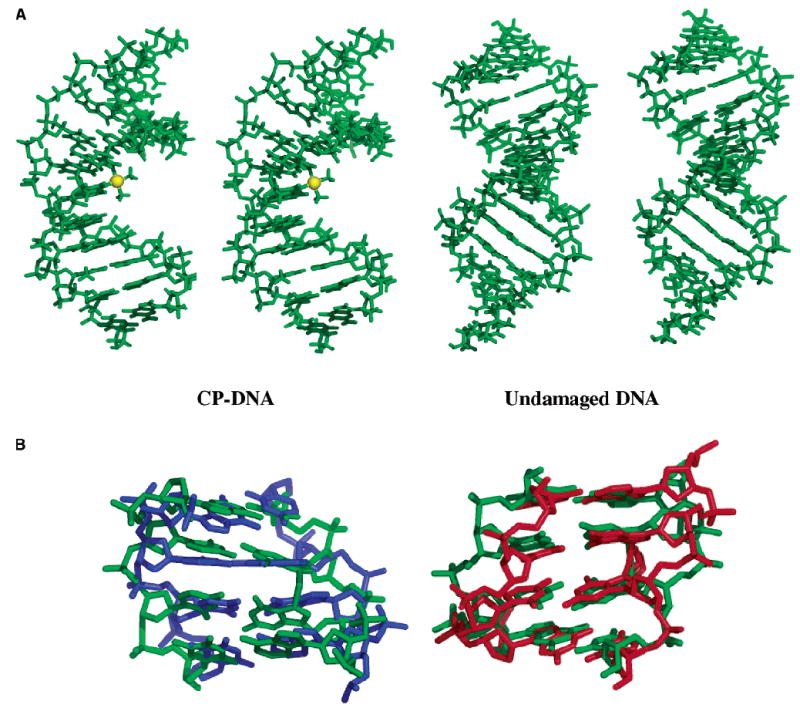
FIGURE 7.

(A) Stereoviews of the average solution structures of the CP–DNA duplex (left) and undamaged DNA (right) in the AGGC sequence context. The platinum atom in the CP–DNA adduct is shown as a yellow sphere. (B) Comparison of the central 4 bp of the CP–DNA adduct (green) with those of the undamaged DNA (blue) and OX–DNA adduct (red) (26).
