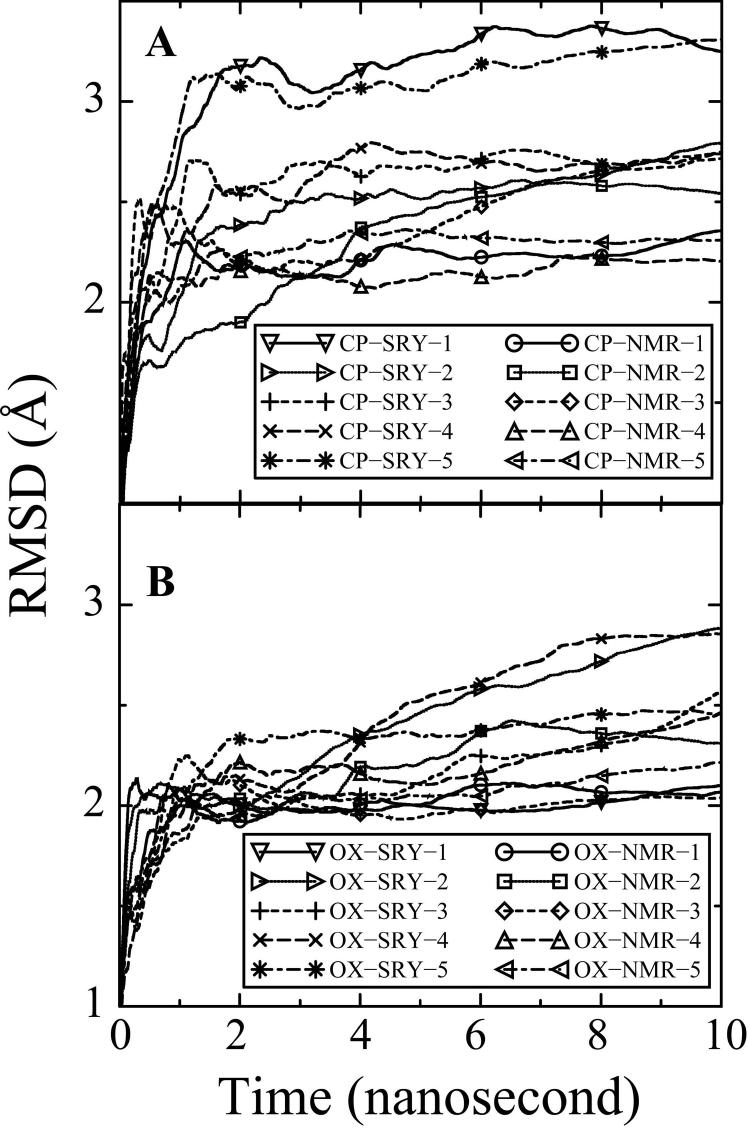
Figure 1. Average RMSDs for the MD simulations over time.
The RMSDs for each of the 20 simulations compared to the corresponding NMR solution structure30 ,33 for the CP-DNA (Figure 1A) and OX-DNA adducts (Figure 1B) are shown for the full 10 ns of each simulation. RMSD at time t represents the average of RMSD from time zero to time t. CP-NMR and OX-NMR represent simulations starting from NMR solution structures of the Pt-DNA 12-mer duplexes. CP-SRY and OX-SRY stand for simulations starting from the more distorted DNA•SRY structures. The five simulation trajectories starting from CP-NMR and OX-NMR structures with different initial MD velocities are represented as solid lines (circle symbol), dotted lines(square symbol), dashed lines (diamond symbol), long dashed lines (upward triangle symbol) and dot-dashed lines (left triangle symbol). The five simulation trajectories starting from the more distorted CP-SRY and OX-SRY structures with different initial MD velocities are represented as solid lines (downward triangle symbol), dotted lines (right triangle symbol), dashed lines (plus symbol), long dashed lines (cross symbol) and dot-dashed lines (asterisk symbol).

