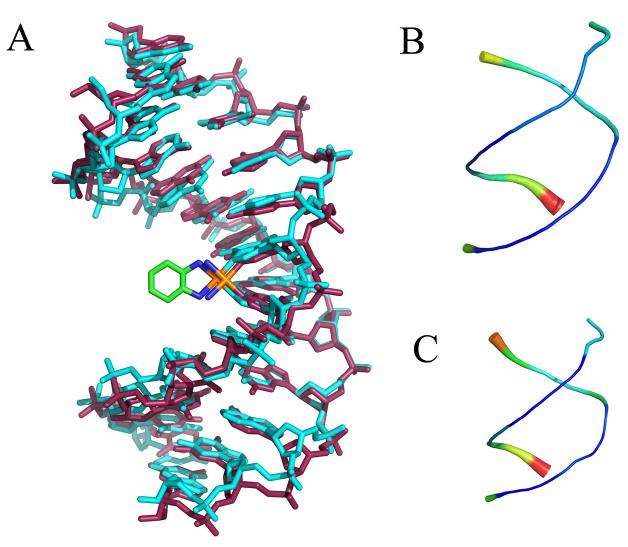
Figure 2.
Average CP-DNA and OX-DNA structures were obtained using the AMBER ptraj tool. In each case, the overall average structure was computed over the equilibrated final 6 ns trajectories combined for the five independent simulations starting with the CP-SRY, CP-NMR and OX-SRY, OX-NMR respectively. Pairwise Kabsch alignment was performed for the SRY and NMR starting structures. Because the RMSDs indicated that the starting structure had little influence on the average structure (RMSD = 0.83 Å for CP-SRY versus CP-NMR and 1.03 Å for OX-SRY versus OX-NMR), the two average structures were further averaged to obtain a single average structure for the last 6 ns of all 10 simulations of the CP-DNA and OX-DNA adducts. Kabsch alignment was then performed against CP-DNA and OX-DNA average structures against every 1 ps snapshot of simulation trajectory. The CP-DNA and OX-DNA MD simulation snapshots having lowest RMS deviations with corresponding average structures were selected as the centroid structures. A. Overlay of CP-DNA and OX-DNA centroid structures. Cyan = OX-DNA; purple = CP-DNA. B and C “Sausage diagrams” of CP-DNA and OX-DNA centroid structures, respectively. Root mean square atomic fluctuations of the CP-DNA and OX-DNA phosphate backbone were obtained by averaging the backbone fluctuations over the 30000 snapshots of equilibrated final 6 ns of all 10 simulation trajectories. The atomicfluct routine in the AMBER ptraj tool was used to compute these fluctuations. The backbone thickness and color (in a scale varying from blue to red) corresponds to the relative fluctuations of CP-DNA (B) and OX-DNA (C) backbone phosphates.

