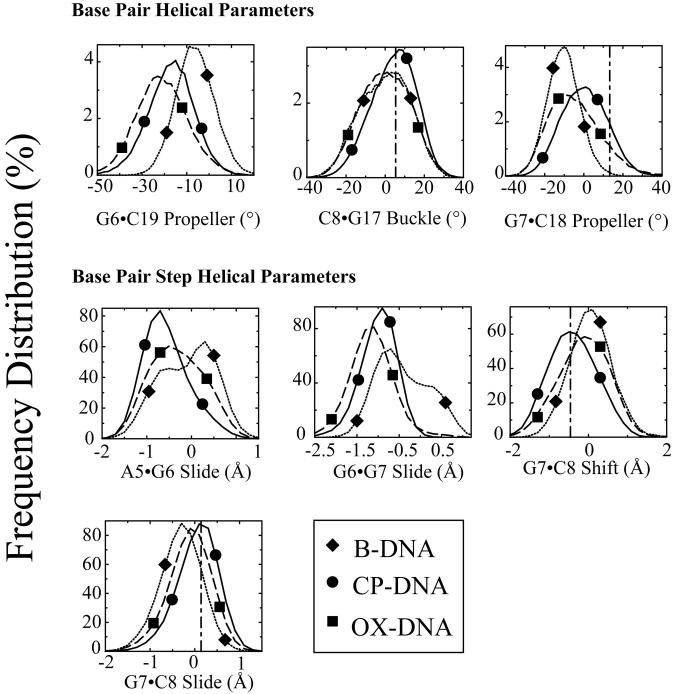
Figure 7. Frequency distributions of representative DNA duplex helical parameters for the central four base pairs: Differences between CP-DNA and OX-DNA adducts.
Frequency distributions of each DNA duplex helical parameter for the central four base pairs were calculated from the simulation trajectories by CURVES v5.3 as described in Methods. The frequency distribution histograms were calculated from the structures obtained at every picosecond over the final 6 nanosecond of each equilibrated MD simulation. Thus, the histograms for CP-DNA and OX-DNA adducts were derived from 60,000 structures, while the histograms for undamaged DNA were derived from 30,000 structures. Selected frequency distributions that show differences between CP-DNA and OX-DNA adducts are shown. B-DNA (dotted lines with diamond symbols), CP-DNA (solid lines with circle symbols); OX-DNA (long dashed lines with square symbols) (The symbols do not represent the data points; rather they are shown to help distinguish the curves.) The vertical dash-dot lines show the value of the corresponding DNA helical parameter on the 3' side of the adduct in the crystal structure of the HMG-CP-DNA adduct26.

