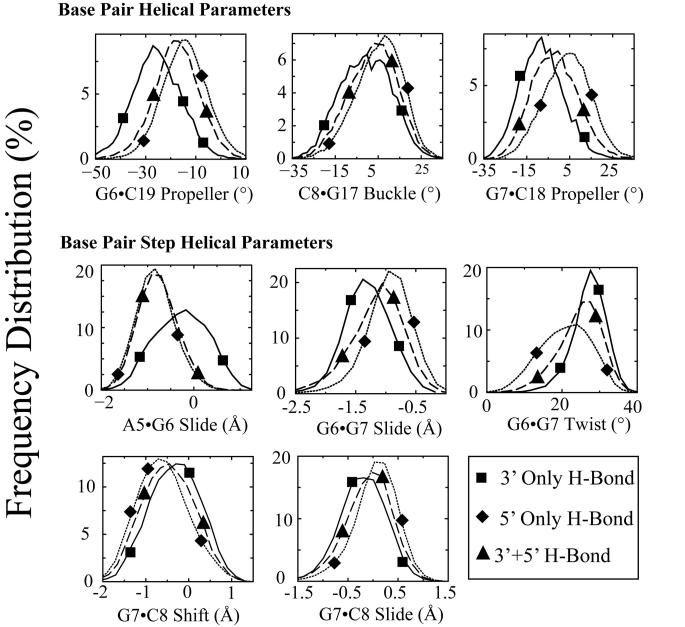
Figure 8. Effect of hydrogen bonding patterns on frequency distributions of selected DNA duplex helical parameters for the central four base pairs of CP-DNA adducts.
The effect of hydrogen bond patterns between the Pt-amine hydrogens and adjacent DNA bases on the frequency distributions of each DNA duplex helical parameter for the central four base pairs of the CP-DNA adduct were determined as described in Methods. The frequency distribution histograms were obtained from all of the CP-DNA structures containing a particular hydrogen bond pattern (Table 2). Thus, the histograms for 5' only, 5' plus 3' and 3' only hydrogen bonds were obtained from 24120, 20400 and 7980 structures, respectively. Selected frequency distributions that show difference in the distribution of DNA helical parameters when the hydrogen bond exists on the 5' side compared to when the hydrogen bond exists on the 3' side of the CP-DNA adduct are shown. 3' Hydrogen bond only (solid lines with square symbols); 5' hydrogen bond only (dotted lines with diamond symbols); hydrogen bonds on both 3' and 5' sides (long-dashed lines with upward triangle symbols) (The symbols do not represent the data points; rather they are shown to help distinguish the curves.) The frequency distributions for no hydrogen bonds on either the 3' side or 5' side are not shown for ease of viewing.

