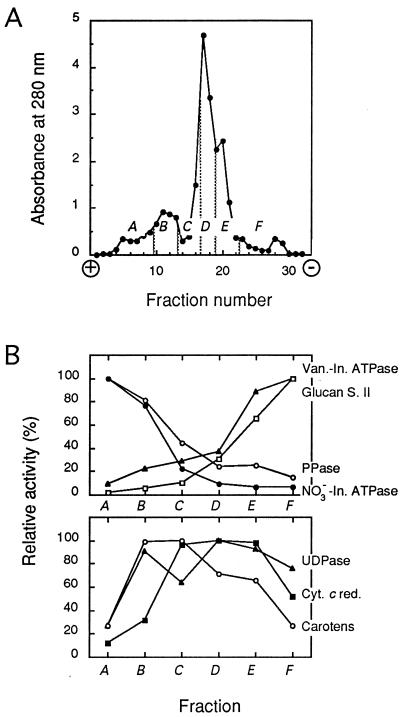
Figure 1.
FFE separation of tobacco cell membranes. (A) Representative separation profile determined by absorbance at 280 nm. A–F, pooled fractions. (B) Membrane marker activities in the A–F membrane fractions expressed as the percentage of the highest specific activity detected in either fraction. Mean data from four independent membrane separations and enzymatic activity measurements are shown. Specific activities at 37°C (100%; in millimoles per hour per milligram of protein) were as follows: vanadate-inhibited ATPase (Van.-In. ATPase; ▴), 9.25; glucan synthase II (Glucan S. II; □), 4.57; pyrophosphatase (PPase; ○), 9.32; NO3−-inhibited ATPase (NO3−-In. ATPase; •), 2.37; latent uridine-5′-diphosphatase (UDPase; ▴), 8.50; NADPH-cytochrome c reductase (Cyt. c red.; ▪), 25.20; carotenoids (Carotens; ○), 100% represents 3.07 mg per mg of protein.

