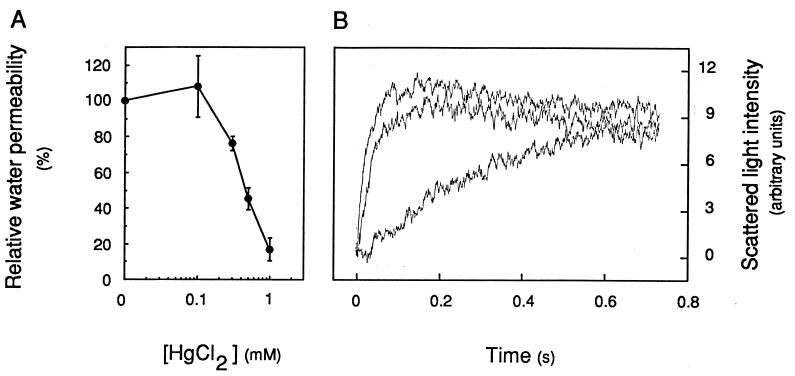
Figure 5.
Mercury inhibition of osmotic water transport in TP-enriched vesicles. (A) Dose dependence of inhibition. Vesicles were preincubated at room temperature for 5 min at the indicated HgCl2 concentration; Pf values were measured at 20°C in the presence of an 80 mosmol⋅kg−1 mannitol gradient and were reported to the Pf value measured in control untreated vesicles. (B) Reversion of mercury inhibition by a reducing agent. Top curve, untreated control (k = 43.9 s−1); middle curve, after exposure for 5 min to 1 mM HgCl2 and for 15 min with the addition of 10 mM 2-mercaptoethanol (k = 31.5 s−1); bottom curve, after exposure for 5 min to 1 mM HgCl2 (k = 4.2 s−1). Note that the slowly decaying plateau of the top and middle curves may indicate a slight permeability of the TP vesicles to mannitol in this experiment.

