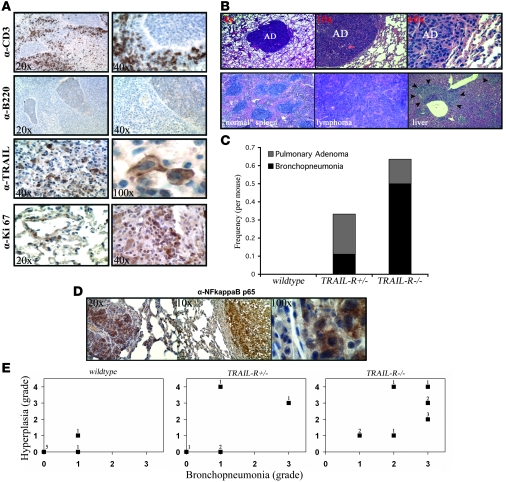
Figure 6. Loss of TRAIL-R leads to increased infiltration of CD3+ cells and tumorigenesis following sublethal irradiation.
(A) Immunohistochemistry on lungs from TRAIL-R–/– animals with infiltrates show increased numbers of CD3+ cells but little to no positive staining for B220. Infiltrates contained a number of TRAIL-positive cells expressing cytoplasmic and membrane-bound TRAIL and focal areas that stained positive for Ki-67. (B) Mice lacking 1 or 2 alleles of TRAIL-R show an increased incidence of pulmonary adenomas (top row). Microphotographs show a normal spleen and a splenic lymphoma with metastasis to the liver (bottom row). Lungs from 12 WT, 9 TRAIL-R+/–, and 18 TRAIL-R–/– mice were examined and stained immunohistochemically. (C) The frequency per mouse of pulmonary adenomas in relation to bronchopneumonia is shown. WT, n = 12; TRAIL-R+/–, n = 9; TRAIL-R–/–, n = 18. (D) Irradiated TRAIL-R–/– animals show correlation between bronchopneumonia and hyperplasia in their lungs. Hyperplastic adenomatous focal lesions (left panel) and pulmonary adenomas (middle and right panel) in the lungs of irradiated TRAIL-R–/– animals showed positive immunohistochemistry for NF-κB p65. Staining was observed in the cytoplasm and nucleus (right panel) of adenomatous cells. Representative photographs of investigated animals are shown. (E) Lungs of irradiated animals of the different TRAIL-R genotypes (WT, n = 7; TRAIL-R+/–, n = 5; TRAIL-R–/–, n = 10) were blindly classified according to inflammatory grade (bronchopneumonia grade) by the use of histological examination and immunohistochemistry for CD3 and fibronectin. Preneoplasia/neoplasia (hyperplastic) grading was based on combined macroscopic observations, histological findings (H&E staining), and immunohistochemistry for Ki-67. Grade 0, no or only scattered stained cells constituting less than 2% of the section; grade 1, heterogeneous staining with at least 20% of the section showing 2%–10% positive cells; grade 2, at least 20% of the section showing 11%–50% positive cells; grade 3, and at least 20% of the section showing more than 50% positive cells. For hyperplasia/neoplasia, presence of adenoma was classified as grade 4. The n-value represented by each data point is shown.

