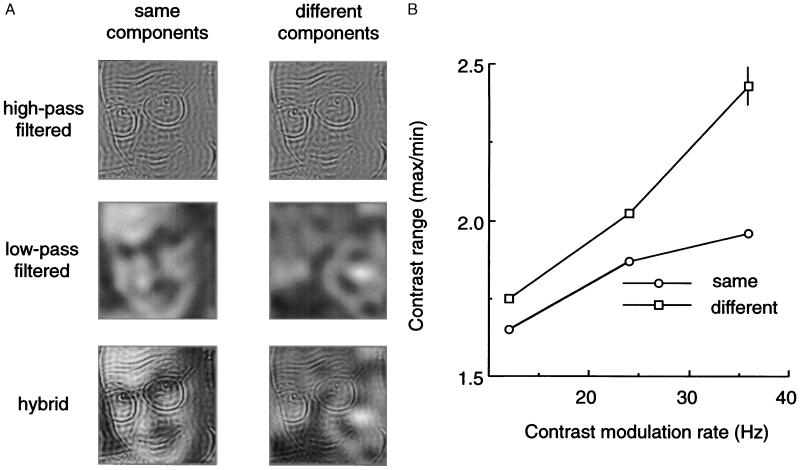
Figure 2.
(A) Starting with 8-bit gray scale images of natural scenes, faces, and dot patterns, hybrid pictures were created by spatial frequency filtering. Original pictures were filtered to produce HP images (all low spatial frequencies removed) and LP images (all high spatial frequencies removed); LP and HP filter cutoff values (3 dB) were separated by 1.5 octaves and, at the 1.07 m viewing distance, corresponded to 2.35 c/deg and 6.57 c/deg; these LP and HP values were selected to promote activation of separate populations of spatially frequency-tuned neurons. Various HP and LP components were then combined (i.e., gray scale values added on a pixel-by-pixel basis) to produce hybrid pictures in which the two components were drawn from the “same” original (e.g., LP and HP components from a given face) or were drawn from “different” originals (e.g., HP from a face and LP from random dots). A given hybrid image was presented during both intervals of a two-interval, forced-choice trial; during one, randomly selected interval the pattern of temporal contrast modulations of the two hybrid components was identical (i.e., synchronized) and during the other interval the modulations were uncorrelated (i.e., unsynchronized). On half of the trials the LP component and the HP component of the hybrid were drawn from the same original (i.e., same condition), and on the remaining half of the trials the LP and HP components were drawn from different originals (i.e.,different condition); “same” and “different” trials were randomly intermixed within a block of 60 trials. On each trial, observers simply indicated in which interval the contrast modulations were synchronized, guessing if necessary without feedback. On any given trial, contrast modulations in the two successive presentations were restricted to a range of contrast values centered around an rms value of 0.30; the range was identical on both intervals of any trial, but the range varied randomly from trial to trial. Trials were presented as a method of constant stimuli, to determine the contrast range where observers were able to discriminate synchronized from unsynchronized modulations 75% of the time based on probit analysis. Over different blocks of trials, the rate of contrast modulation was either 12, 24, or 36 Hz (corresponding to frame durations of 83.3, 41.6, or 27.7 msec). In one condition, exposure duration remained constant at 583 msec (such that the total number of frames presented varied directly with modulation frequency), and in another condition the number of frames presented was always seven (such that exposure duration varied inversely with modulation frequency); both of these conditions yielded the same pattern of results for all four observers. The gray scale pictures (2.1 deg2; 24.5 cd m−2 average luminance) were presented on a Radius video monitor (1152H × 882V pixel resolution; P104 phosphor; 72 Hz refresh rate) under control of an accelerated Macintosh IIx computer. Calibrated look-up tables corrected luminance nonlinearities. Observers initiated trials and indicated responses using keys on the computer keyboard; error feedback was not given except during a block of 10 practice trials preceding each test session. Each of four observers completed 1,200 trials for each type of stimulus. (B) Threshold contrast range (expressed as the ratio of the maximum and minimum contrast values) for discriminating synchronized from unsynchronized contrast modulations when HP and LP components were drawn from the same original (Same) and when those components were drawn from different originals (Different); average results for the four observers are shown for each of the three modulation rates tested under the condition where trials always involved seven-frame presentations (i.e., exposure duration varied inversely with modulation rate). The pattern of results was identical for all four observers, and the differences between same and different conditions are statistically significant (z-score two-tailed test, P < 0.001); the vertical bar denotes the average standard error. The observer’s task had nothing to do with identifying the components of the hybrids, only whether or not the temporal pattern of modulations in contrast of the two components was identical. Threshold values were impossible to estimate under a condition where the two components of the synchronized condition were offset by one frame, because these phase lag presentations were always indiscriminable from the unsynchronized presentations regardless of contrast range.

