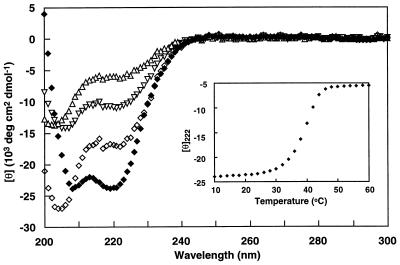
Figure 2.
CD spectra of SIV N36 and C34 peptides. CD spectra of SIV N36 (▿), SIV C34 (▵), and the SIV N36 C34 complex (♦) in PBS. The predicted spectrum for noninteracting peptides (⋄) is shown for comparison. Inset shows the thermal dependence of the CD signal at 222 nm for the SIV N36/C34 complex.

