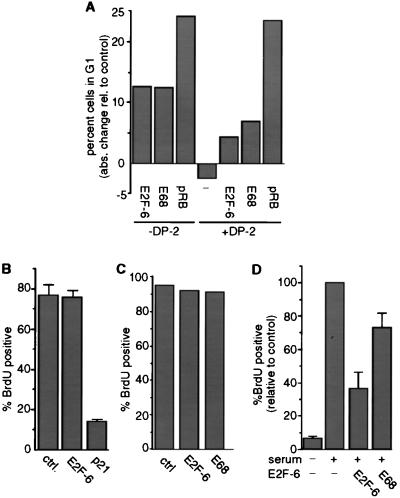
Figure 5.
E2F-6 does inhibit S-phase entry in starved cells but not in asynchronously growing cells. (A) Saos2 cells were cotransfected with the indicated expression vectors and CMV-GFP. Transfected cells were identified by their green fluorescence and analyzed by FACScan 2 days after transfection. Shown is the absolute change in the number of G1 cells compared with a control transfection with empty vector. The experiment was repeated four times. One typical result is shown. (B) NIH 3T3 cells were cotransfected with 1 μg of the indicated expression vectors; 0.5 μg of CMV-GFP was cotransfected. Fourteen hours after transfection, cells were labeled with BrdU for 20 hr. Cells were stained with an anti-BrdU antibody and with a rhodamine-coupled secondary antibody. Transfected cells were identified by their green fluorescence, and the number of these cells with coexisting red fluorescence (i.e., the BrdU-positive cells) was determined. The experiment was repeated several times. The mean results from one experiment performed in independent triplicates are shown. Error bars represent standard deviation. (C) NIH 3T3 cells were microinjected with 25 μg/ml E2F-6 or E2F-6E68 expression plasmid and CMV-GFP (10 μg/ml). Ten hours after microinjection, 50 μM BrdU was added for 20 hr. DNA synthesis was analyzed as described above with an anti-BrdU antibody and with a rhodamine-coupled secondary antibody. (D) E2F-6 inhibits reentry into S phase of serum-starved NIH 3T3 cells. NIH 3T3 cells were serum starved in 0.1% bovine calf serum for 48 hr and than microinjected with 25 μg/ml E2F-6 or E2F-6E68 expression plasmid. In each case CMV-GFP (10 μg/ml) was coinjected. Ten hours after injection, cells were restimulated with 5% serum, and BrdU (50 μg/ml) was added. After 17.5 hr, cells were fixed and stained with an anti-BrdU antibody as described above. The mean results from four independent experiments are shown. Values were normalized to the number of uninjected cells that had entered S phase in each experiment. In a typical experiment, 60% of serum-treated, uninjected cells had entered S phase. Error bars represent standard deviation.

