
Figure 2.
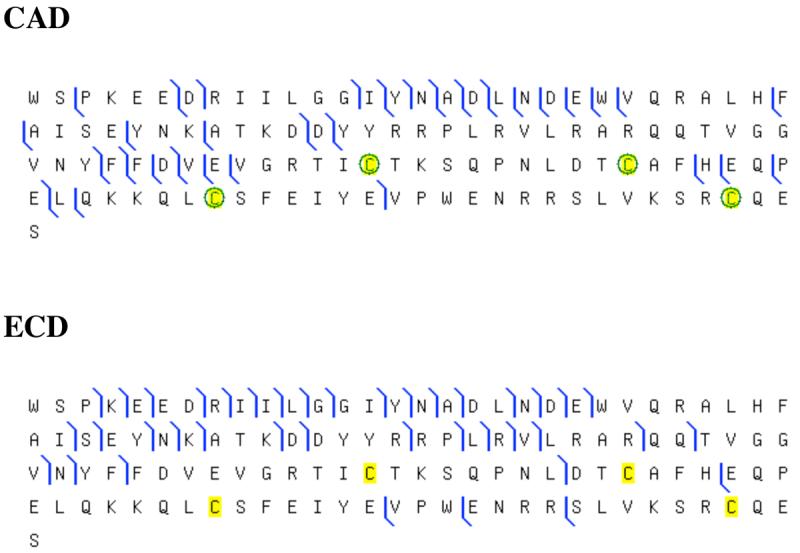
Sequence coverage from top-down mass spectrometry on human salivary Cystatin SN. The graphical output of Prosight PTM was used to illustrate assigned ions from CAD and ECD experiments shown in Figure 1. In the case of CAD the Cys residues were oxidized to disulfides (−1.007825 Da each).