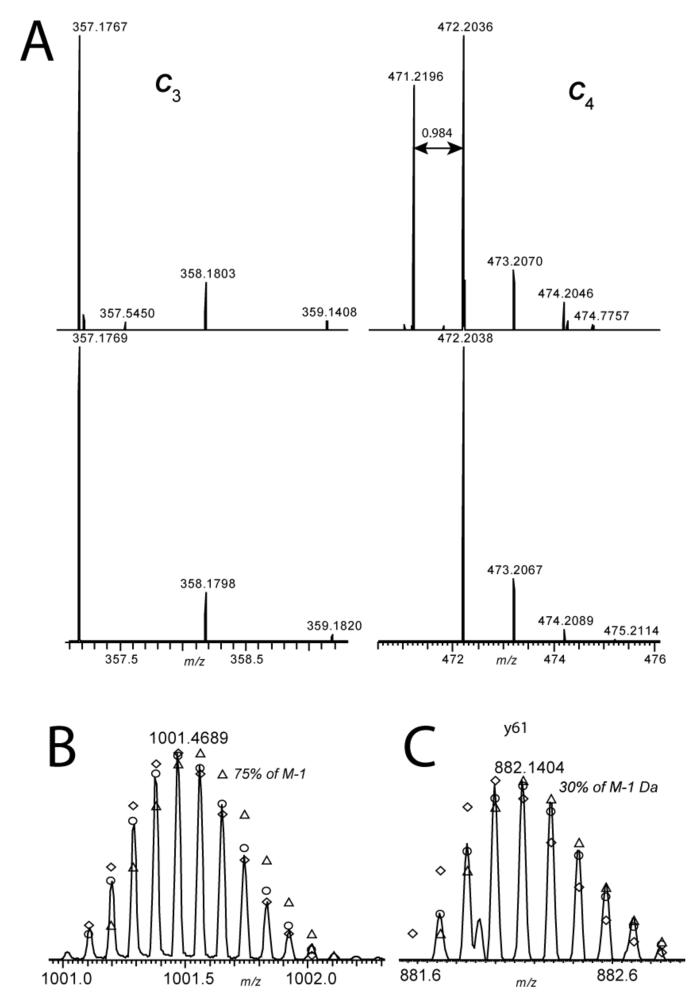
Figure 4.
Isomeric/isobaric forms of PRP3. A. Shows the experimentally determined c3 and c4 ions (upper) compared to theoretical ions (lower). The c4 ion clearly shows the appearance of the amidated isoform at position 4. B. The molecular ion fits a model with 75 % amidated isoforms (open circles). The open triangles represent the distribution expected for the D form whereas the open diamonds represent that expected for the N (amidated) isoform. C. The profile of y61 fits a model with around 30% contribution from an amidated form, this time due to D50N (open circles). The open triangles represent the distribution expected for the D form whereas the open diamonds represent that expected for the N (amidated) isoform.

