
Figure 3.
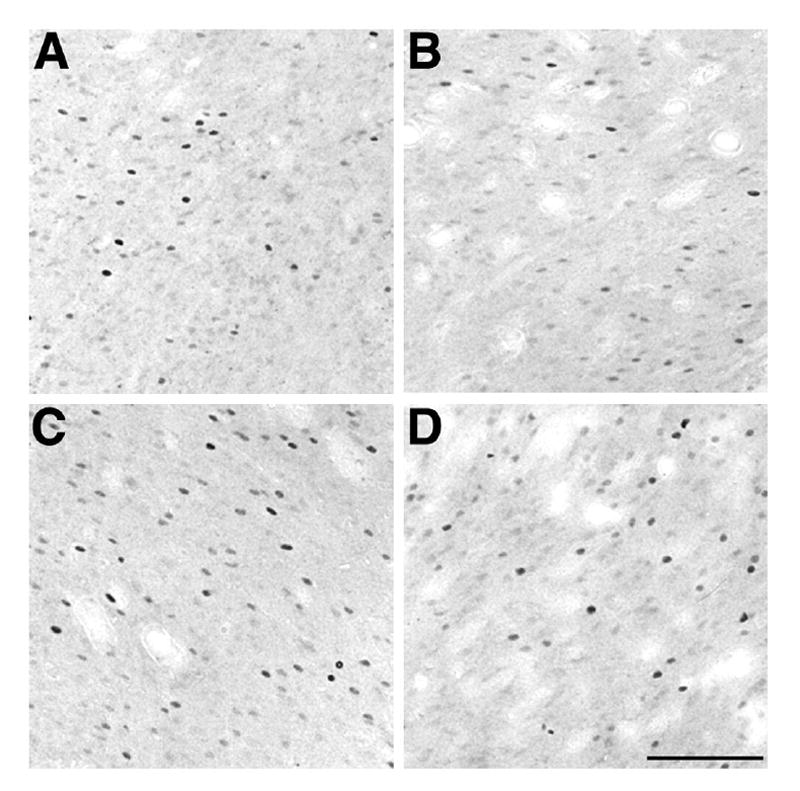
Brightfield photomicrographs depicting the effect of AMPH and saline conditioning on Fos immunoreactivity in the NAcC. Density of Fos-IR cells when A. saline was administered in the AMPH-paired context; B. saline was administered in the saline-paired context; C. AMPH was administered in the AMPH-paired context; and D. AMPH was administered in the saline-paired context. Compare the Fos-IR cell density in A with B and C with D. Scale bar in D is valid for A-C = 100 μm.