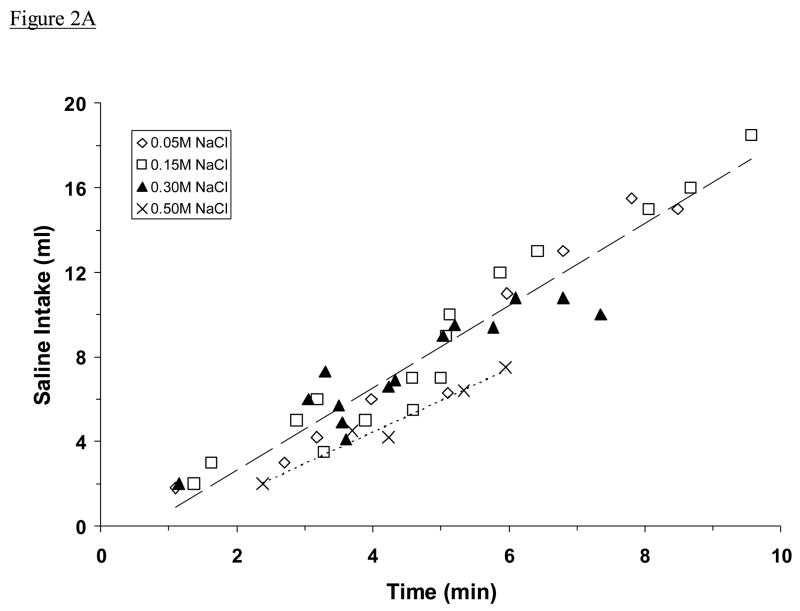
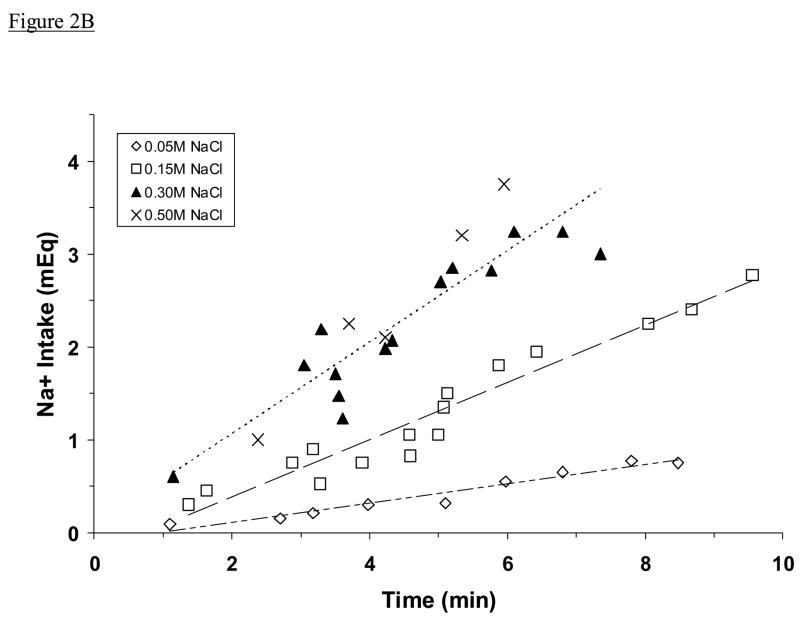
Fig. 2.
Mean intakes of NaCl solution by adrex rats, plotted as a function of time spent drinking. Shown are intakes in ml (A) and in meq Na+ (B). Symbols represents data from individual animals, dashed lines represent regression lines. Regression equations in Fig. 2A: for 0.05 M, 0.15 M, and 0.30 M NaCl (upper line), y = 1.9445x – 1.2263; for 0.50 M NaCl, y = 1.4904x – 1.5187. Regression equations in Fig. 2B: for 0.05 M NaCl (lower line), y = 0.1038x – 0.0991; for 0.15 M (middle line), y = 0.3086x – 0.2380; for 0.30 M and 0.50 M NaCl (upper line), y = 0.4924x + 0.0819. The very high correlations between fluid intake and drinking time (Fig. 2A: r = 0.96, 0.98; Fig. 2B: r = 0.97, 0.97, 0.90, respectively; all Ps <0.001) suggest a steady rate of intake by these animals (excluding pauses). Adrex rats consumed 0.05 M, 0.15 M, or 0.30 M NaCl more rapidly in ml/min than they consumed 0.50 M NaCl, whereas they ingested 0.30 M and 0.50 M NaCl at the fastest rate in meq Na+/min.


