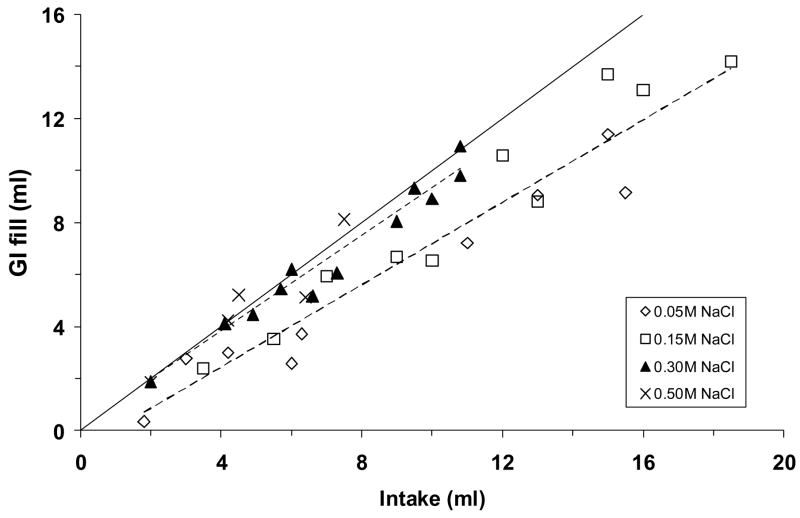
Fig. 6.
The sum of the measured fluid in the stomach and small intestine, plotted as a function of saline intake. Data are from the same adrex rats as in Figs. 2–5. Symbols represent data from individual animals; dashed line represents regression line, solid line represents the “no net absorption” line (i.e., y = x). Regression equations and correlation coefficients: for 0.05 M and 0.15 M NaCl (lower line), y = 0.7918x – 0.7259, r = 0.96, P <0.001; for 0.30 M and 0.50 M NaCl (upper line), y = 0.8714x + 0.3116, r = 0.97, P <0.001. In each of these two groups, gastrointestinal fill was highly correlated with saline intake (both Ps <0.001).

