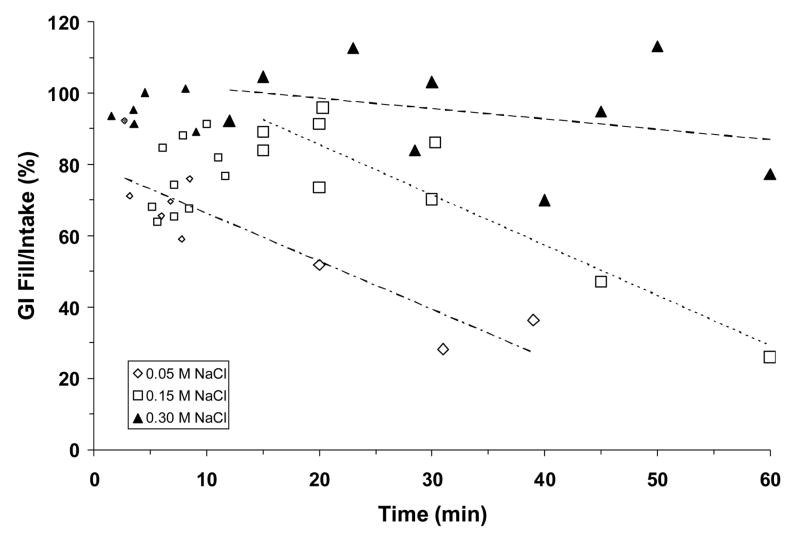
Fig. 7.
Gastrointestinal fill, expressed as a percentage of NaCl solution consumed in an initial drinking bout, plotted as a function of time during the 60-min test. Symbols represent data collected from individual animals either during (small symbols) or after the initial bout (large symbols), dashed lines represent regression lines. Regression equations and correlation coefficients: for 0.05 M NaCl (lower line), y = −1.3485x + 79.8070, r = −0.89, P <0.001; for 0.15 M NaCl (middle line), y = −1.4083x + 113.68, r = −0.92, P <0.001; for 0.30 M NaCl (upper line), y = −0.2908x + 104.41, r = −0.31, P = ns. Equation and correlation coefficient for 0.05 M NaCl includes data from the initial bout. GI fill decreased rapidly when adrex rats drank 0.05 M or 0.15 M NaCl but it changed little when 0.30 M NaCl was consumed.

