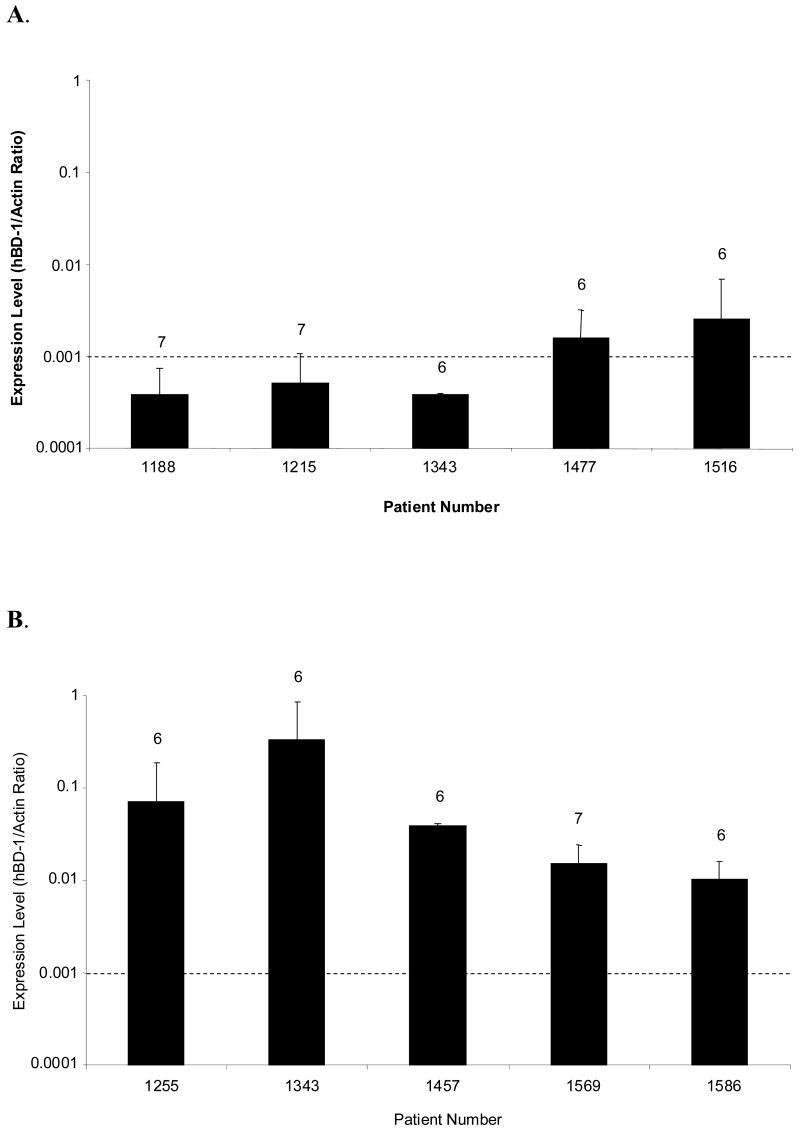
Figure 1. Analysis of hBD-1 Expression in Human Prostate Tissue.
hBD-1 relative expression levels were compared in normal clinical samples from patients that underwent radical prostatectomies. The dashed line serves as a point of reference to compare values obtained between gross and LCM-derived specimen, and corresponding Gleason scores are indicated above each bar. A, hBD-1 expression levels were compared in tissues obtained by gross dissection. B, hBD-1 expression levels were compared in tissue obtained by Laser Capture Microdissection.

