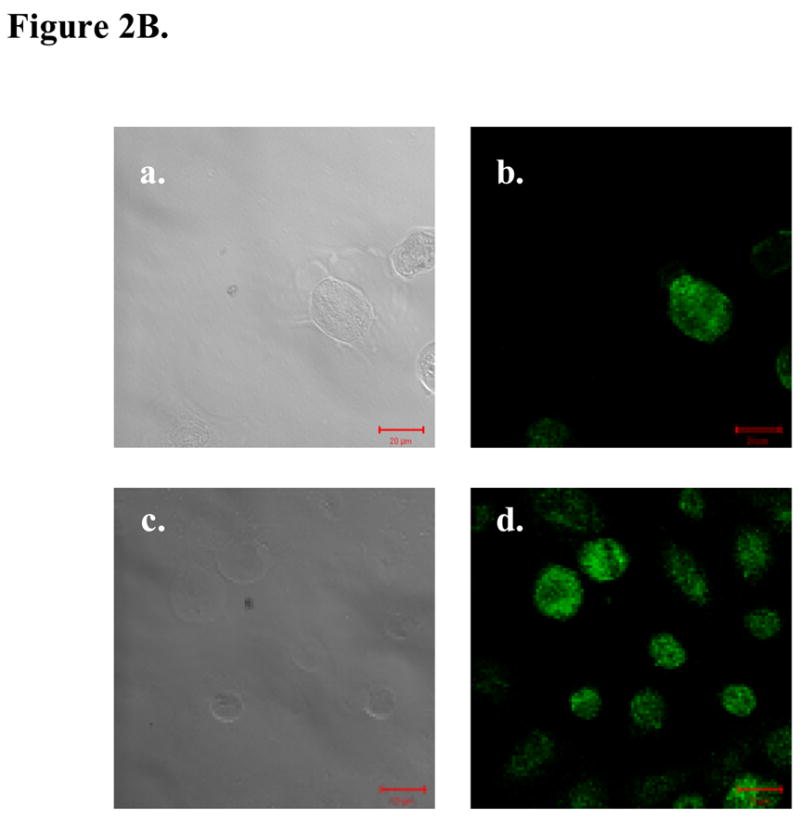
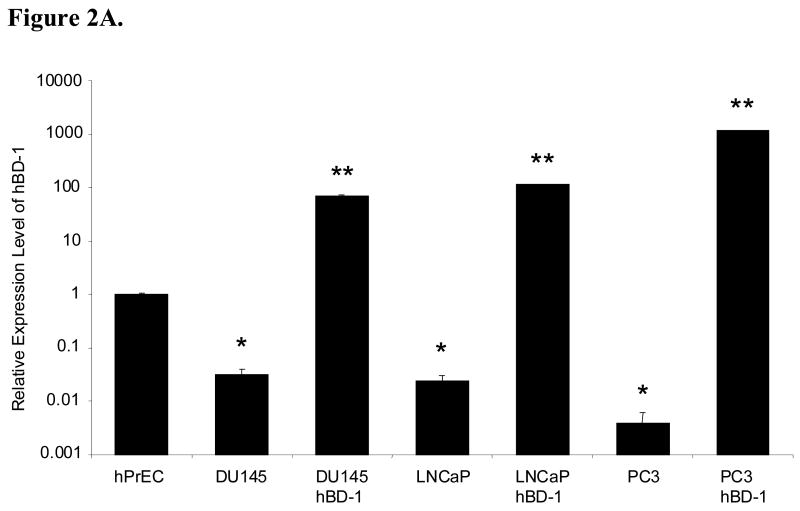
Figure 2. Analysis of hBD-1 Expression in Prostate Cell Lines.

A, hBD-1 expression levels were compared relative to hPrEC cells in prostate cancer cell lines before and after hBD-1 induction. A single asterisk represents statistically lower expression levels compared to hPrEC. Double asterisks represent statistically significant levels of expression compared to the cell line before hBD-1 induction (Student’s T-test, p<0.05). B, Ectopic hBD-1 expression was verified in the prostate cancer cell line DU145 by immunocytochemistry. hPrEC cells were stained for hBD-1 as a positive control (A: DIC and B: Fluorescence). DU145 cells were transfected with hBD-1 and induced for 18 hours (C: DIC and D: Fluorescence). Size bar= 20 μM.

