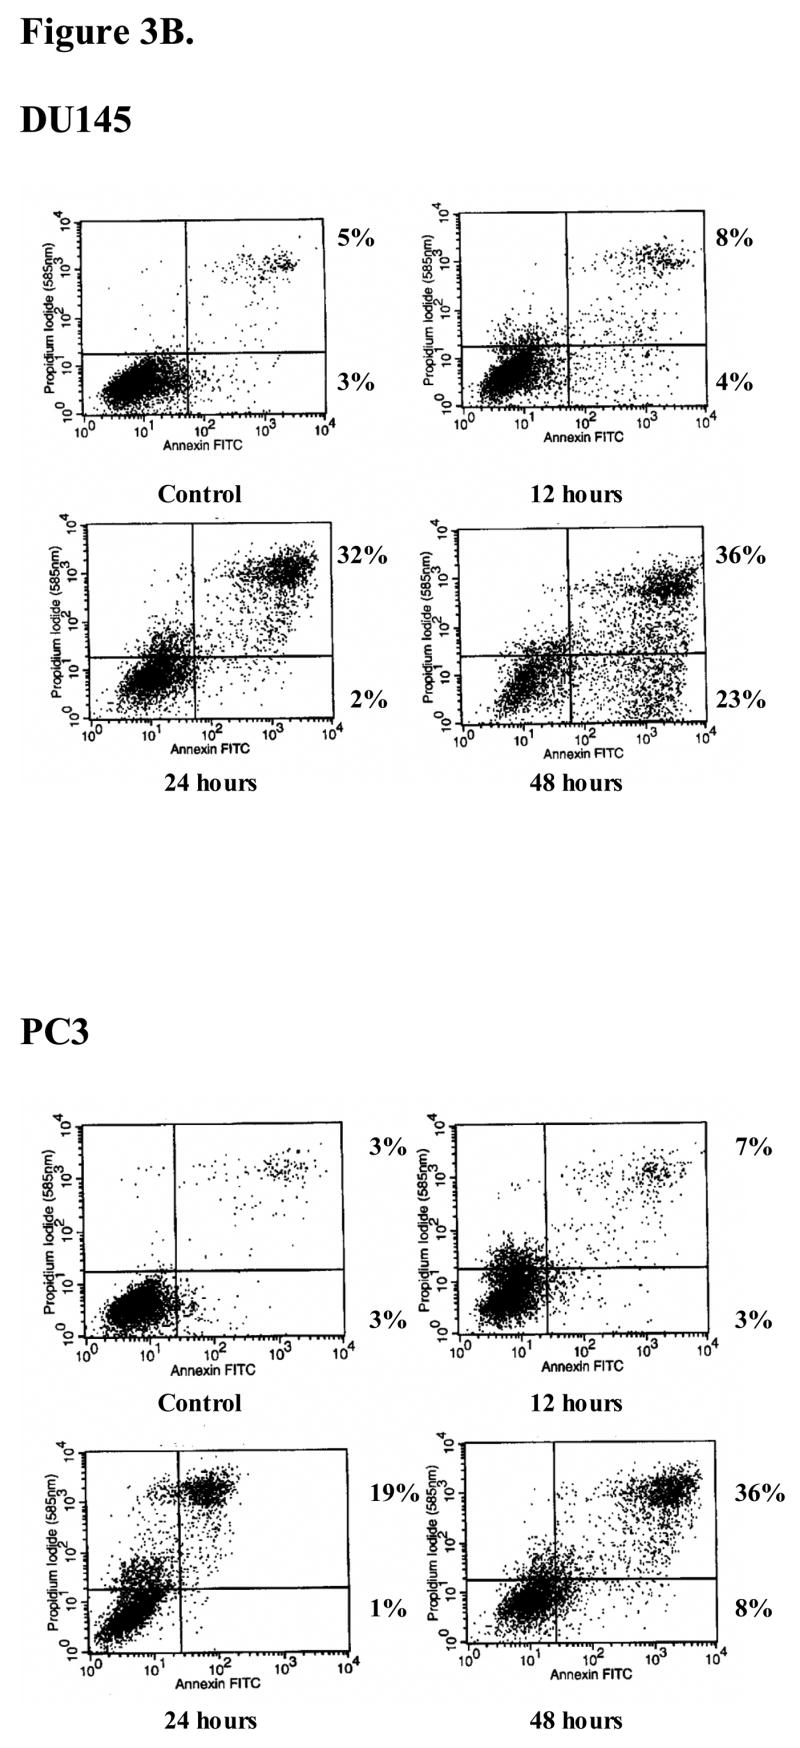
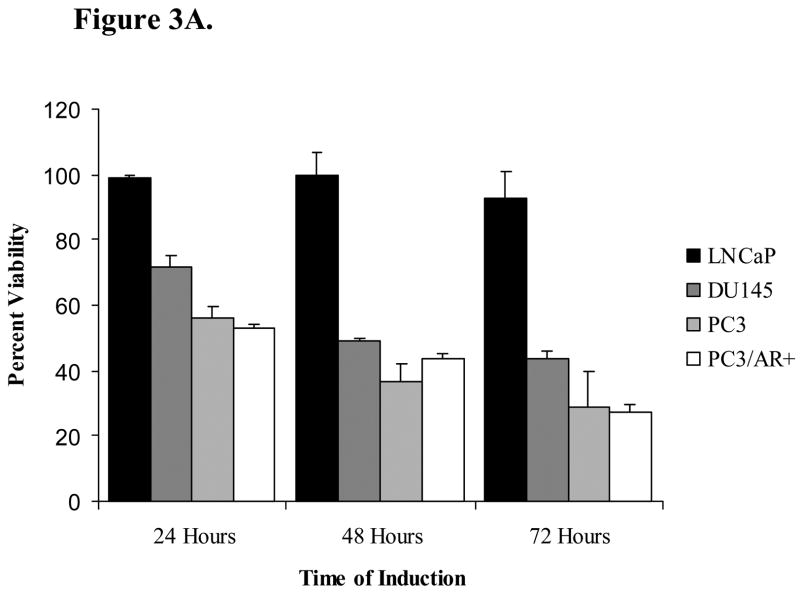
Figure 3. Analysis of hBD-1 Cytotoxicity in Prostate Cancer Cells.

A, the prostate cell lines DU145, PC3, PC3/AR+ and LNCaP were treated with Pon A to induce hBD-1 expression for 1–3 days after which MTT assay was performed to determine cell viability. Each bar represents the mean ± S.E.M. of three independent experiments performed in triplicate. B, cells positive for propidium iodide and annexin V were considered apoptotic. Times of induction are shown under each panel. Numbers next to the boxes for each time point represent the percentages of propidium iodide (PI)− annexin V+ cells (lower right quadrant), and PI+ annexin V+ cells (upper right quadrant).

