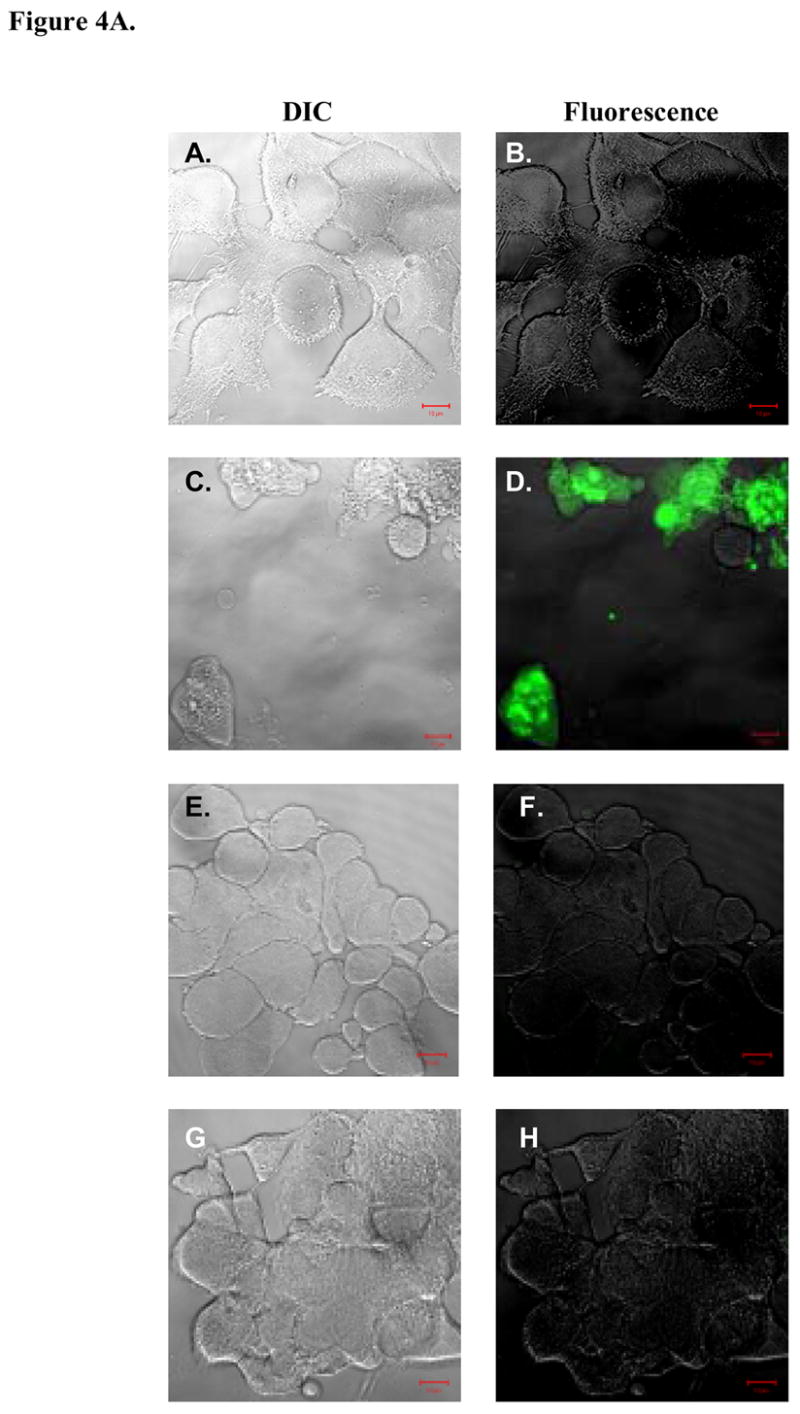
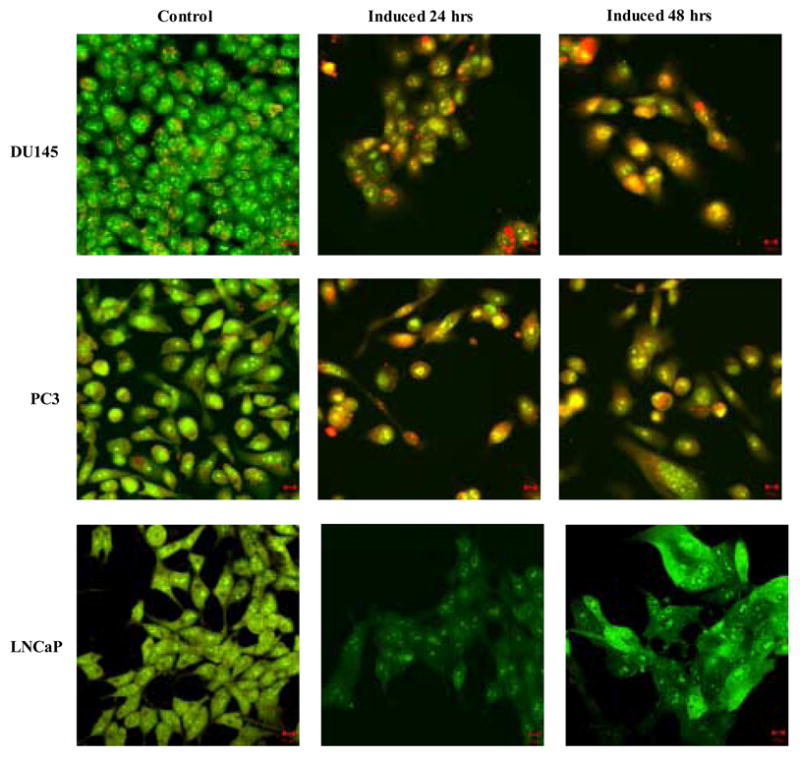
Figure 4. Analysis of hBD-1 mediated cell death.


A, DIC visualization of DU145 cells before (A) and after (C) hBD-1 induction, and LNCaP cells before (E) and after (G) induction. Fluorescence analysis revealed no caspase activity in control DU145 (B) and LNCaP (F) cells. However, cells treated with Pon A for 24 hours to induce hBD-1 revealed caspase activity in DU145 (D), but not in LNCaP (H). B, membrane integrity of DU145, PC3 and LNCaP was analyzed by confocal microscopy 24 and 48 hours after hBD-1 induction. Green staining indicates the localization of AO, red staining represents EtBr and yellow staining represents the co-localization of both AO and EtBr. Size bars= 10 μM.
