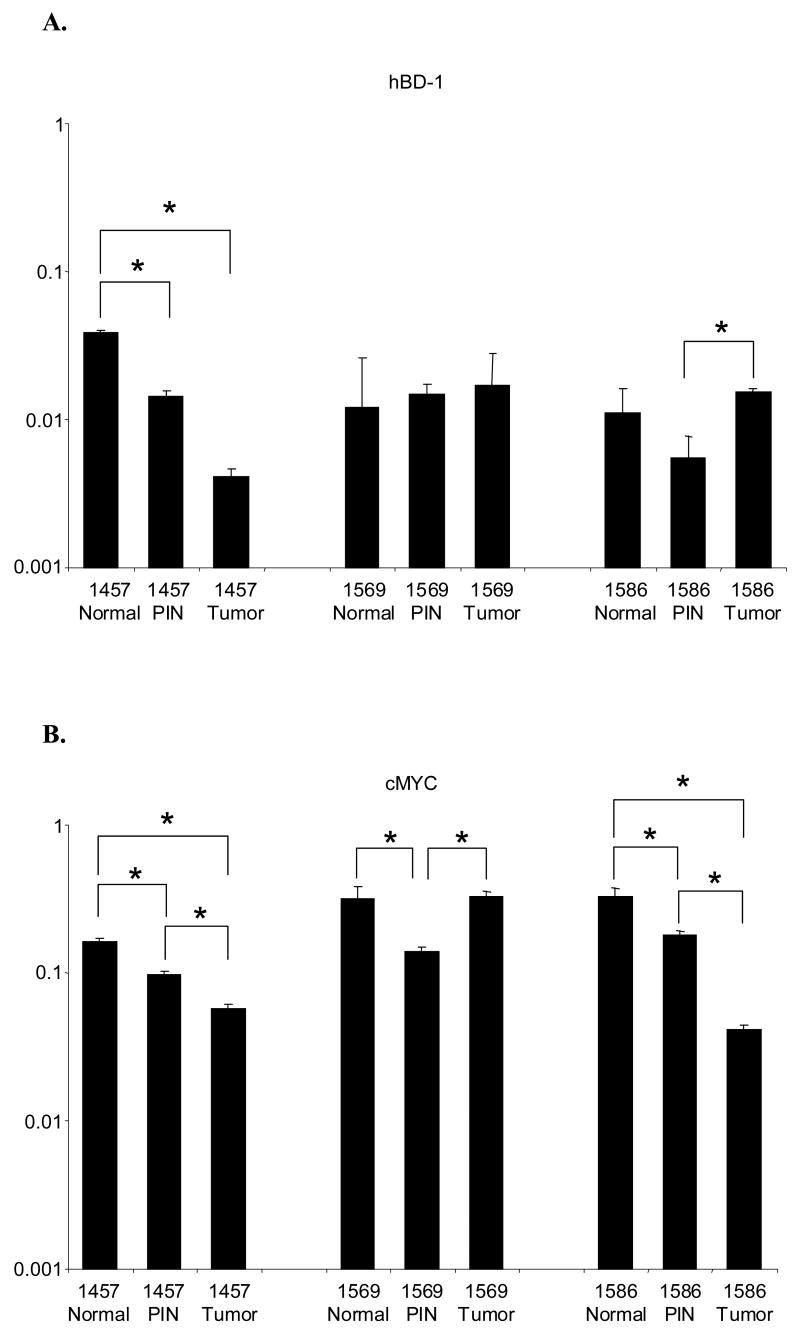
Figure 5. QRT-PCR analysis of hBD-1 and cMYC expression in LCM human prostate tissue sections of normal, PIN and tumor.
Expression for each gene is presented as expression ratios compared to β-actin. A, Comparison of hBD-1 expression levels in normal, PIN and tumor sections. B, Comparison of cMYC expression level in normal, PIN and tumor sections.

