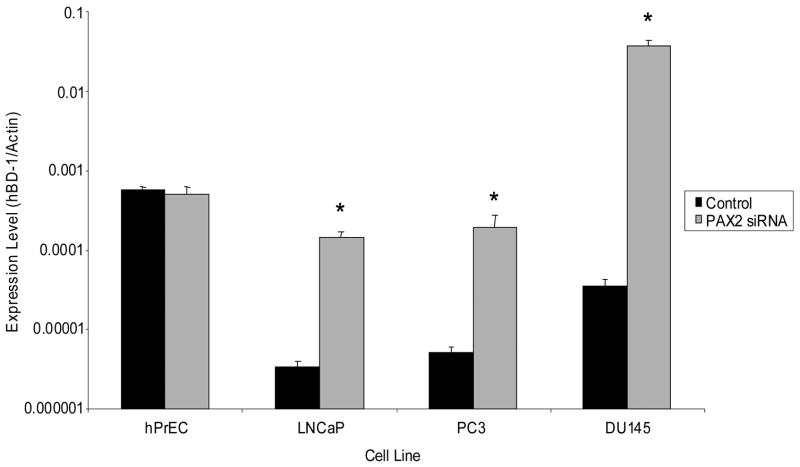
Figure 6. QRT-PCR analysis of hBD1 expression following PAX2 knockdown with siRNA.
hBD-1 expression levels are presented as expression ratios compared to β-actin. A single asterisk represents statistically lower expression levels compared to the cell line before PAX2 siRNA treatment (Student’s T-test, p<0.05).

