
Fig. 3.
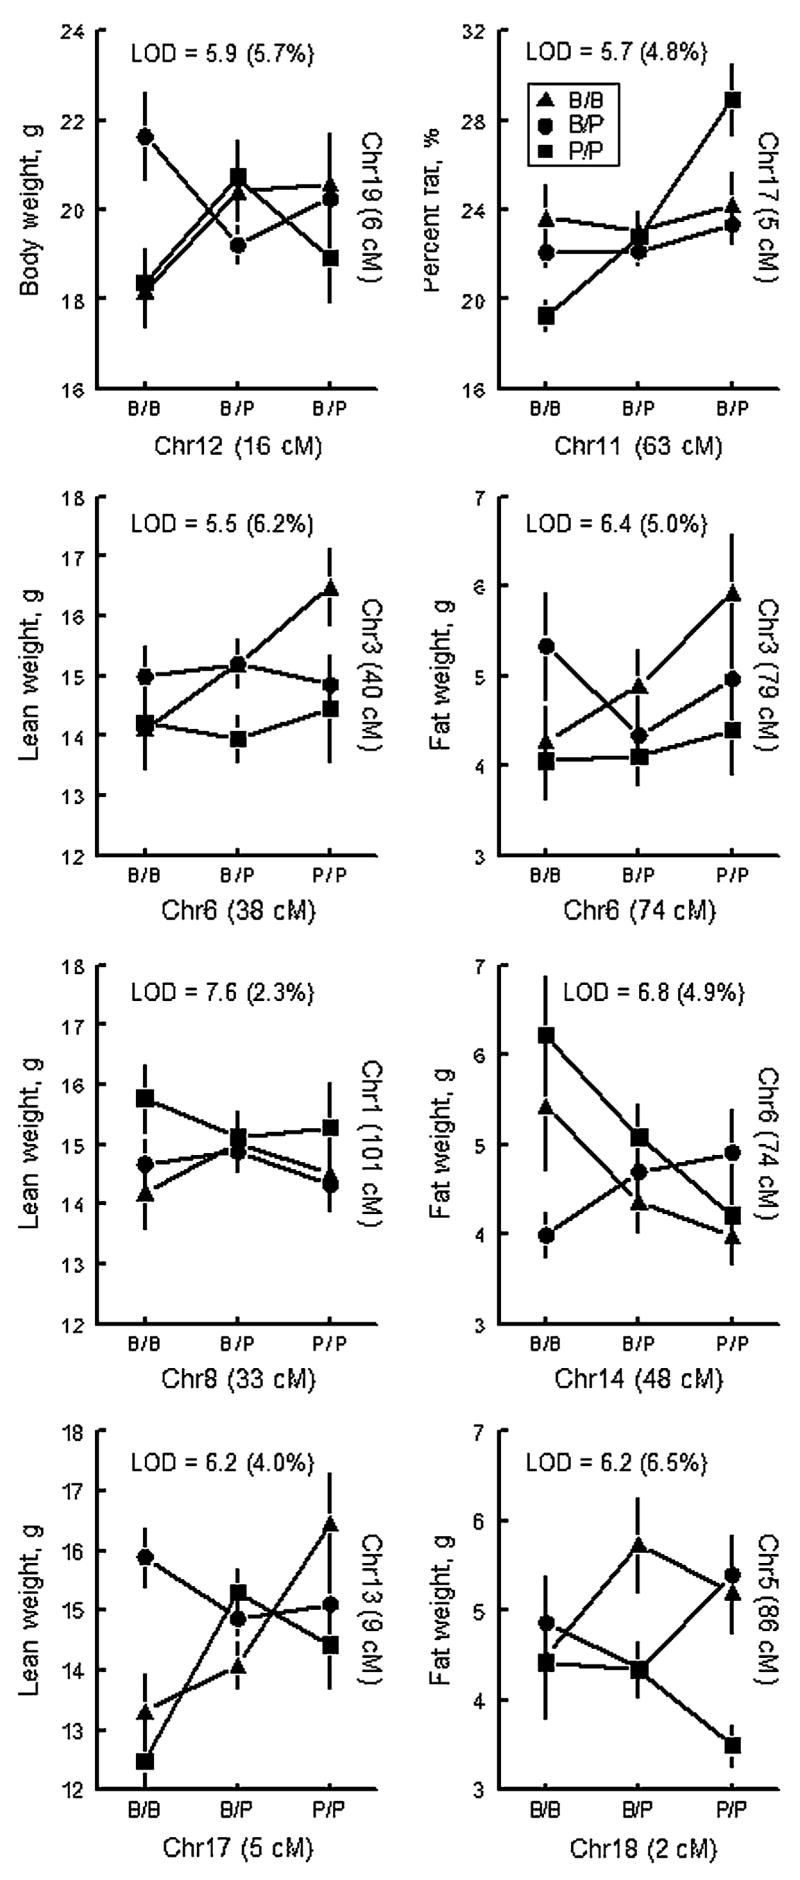
Plots of pairwise interactions. Chromosome number and peak position in cM are indicated for each QTL. Freestanding text = interaction LOD score and percentage of trait variance accounted for
Official websites use .gov
A
.gov website belongs to an official
government organization in the United States.
Secure .gov websites use HTTPS
A lock (
) or https:// means you've safely
connected to the .gov website. Share sensitive
information only on official, secure websites.
Plots of pairwise interactions. Chromosome number and peak position in cM are indicated for each QTL. Freestanding text = interaction LOD score and percentage of trait variance accounted for