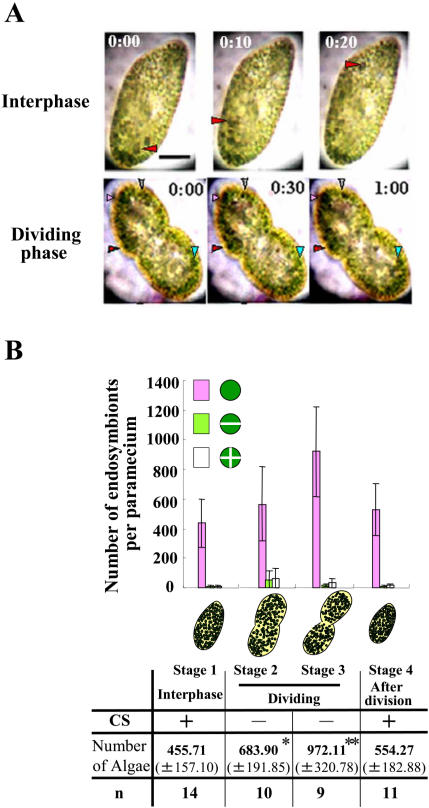
Figure 1. (A) Cytoplasmic streaming in P. bursaria.
Upper (10-second intervals) and Lower panels (30-second intervals); P. bursaria having carmine particles (arrowheads) in the cytoplasm at interphase (stage 1) and dividing phase (stage 2), respectively. Scale bar, 20 µm. (B) A relation between cytoplasmic streaming and the number of endosymbionts. A bar graph shows the number of endosymbionts (±S.D.) at each phase of host cell cycle (stage 1–4). The endosymbionts were classified into a unicellular cell (purple), 2 (green) and 4 autospores (white). A table shows whether cytoplasmic streaming occurs or not, and the total number of endosymbionts. * and ** mean statistical differences with Student's t-test, *P<0.005 and **P<0.001.

