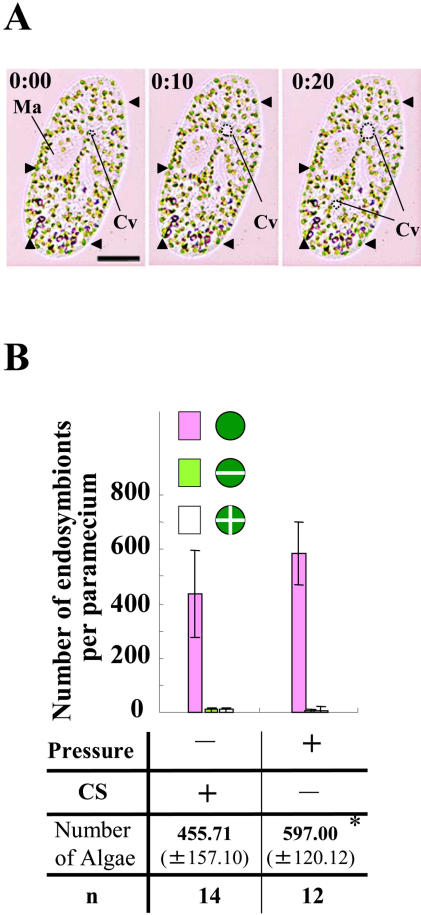
Figure 2. (A) Arrest of cytoplasmic streaming in P. bursaria by pressure (10-second intervals).
P. bursaria at interphase arresting cytoplasmic streaming under pressure. Ma and Cv indicate macronucleus and contractile vacuole (broken lines), respectively. Scale bar, 20 µm. (B) Cytoplasmic streaming-dependent increase of the number of endosymbionts. A bar graph shows the number of endosymbionts (±S.D.) under pressure or non-pressure (control). The control value is the number of endosymbionts at intephase (stage 1) described in Fig. 1B. * means a statistical difference P<0.02.

