Figure 3.
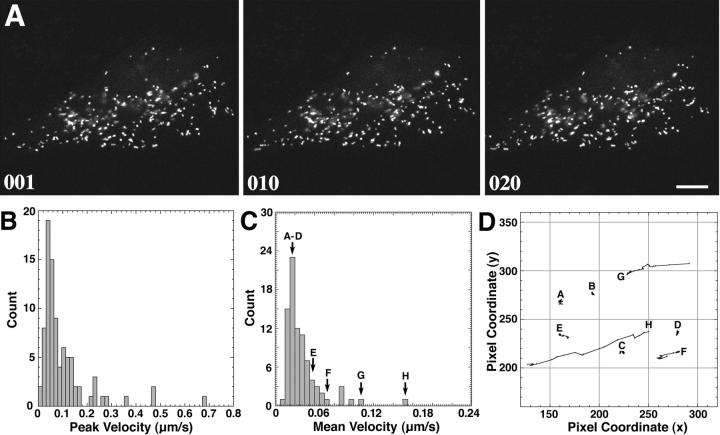
Time-lapse motion analysis of the dynamics of peroxisomes in living CV1 cells expressing GFP–PTS1. A representative single cell was selected, and single-frame confocal images were recorded at 6.4-s intervals for a total of 500 frames. 20 consecutive frames were chosen for motion analysis. (A) Three confocal images from the series are shown at time = 0 (frame 001), time = 64 s (frame 010), and time = 128 s (frame 020). Most peroxisomes displayed a slow, random movement within a limited space, leaving their overall distribution relatively unchanged after ∼2 min. Bar, 10 μm. (B) Plot of the peak velocities of 85 individual peroxisomes (∼50% of the cell population) observed over 20 consecutive frames revealed two distinct types of motion. The majority (95%) exhibited a localized, random type of Brownian motion with peak velocities of <0.2 μm/s. A smaller number (∼5%) exhibited a faster motion characterized by peak velocities of >0.2 μm/s and as great as 0.68 μm/s. (C) Plot of the mean average velocity of 85 individual peroxisomes over 20 consecutive frames also showed two distinct types of motion. The majority exhibited a localized, random type of Brownian motion with an average velocity of <0.05 μm/s, while the faster moving peroxisomes displayed an average velocity of >0.05 μm/s. (D) Vector diagram plot tracking the motion of eight representative individual peroxisomes (A–H) corresponding to those marked in C. A–E exhibited very little net displacement and were characteristic of the majority of peroxisomes. Peroxisome F exhibited sporadic motion, G was relatively stationary for several frames before exhibiting rapid directional motion, and H had a more continuous, rapid directional motion over the time course (1 pixel = 0.13 μm).

