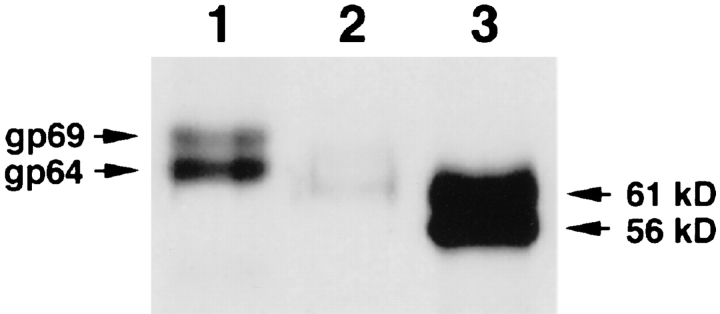
Figure 8.
Effect of PNGase F treatment on gp69/64. Purified gp69 and gp64 (total 1 μg , lane 1) and PNGase F–treated gp69/64 (total 10 μg, lane 3) were separated by 7.5% SDS-PAGE, electrotransferred to membrane, and immunoblotted with specific anti-gp69/64 antibody. The band in lane 3 was much more intense because 10 times as much protein was loaded. The molecular masses of the two bands are marked on the right. Lane 2 shows the 65-kD and 60-kD bands (total 1 μg) generated from crude collagenase digestion of gp69/64.

