
Figure 4.
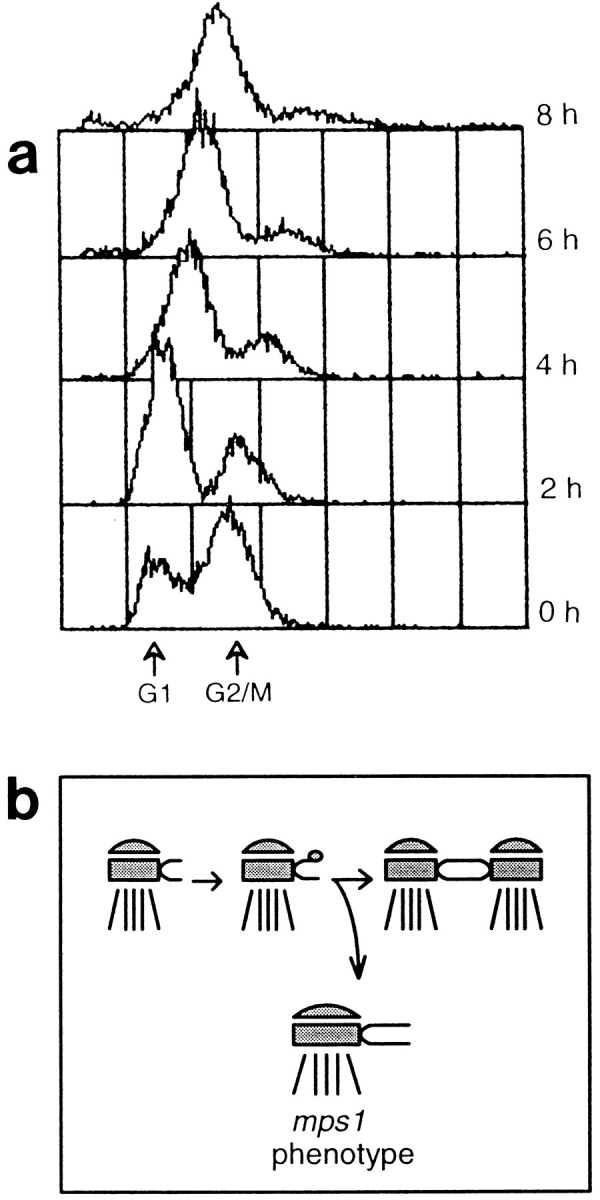

The epistatic relationship between mps1-1237 and cdc37-1 is different for different phenotypes. (a) An asynchronous culture of the mps1-1237 cdc37-1 double mutant strain AS153-12d (Table I) was shifted to 38°C, and cell cycle distribution was monitored by flow cytometry. Samples were taken before the shift (0 h) and at 2-h intervals (2 h–8 h). These cells exhibit the cdc37-1 phenotype; they arrest in G1. A similar G1 arrest is seen in double mutant strains that carry other alleles of mps1. The drift of G1 and G2/M peaks to the right at later time points is attributed to accumulation of mitochondrial DNA as the cells become enlarged. The x-axis is the relative DNA content determined by propidium iodide fluorescence, and the y-axis is the relative number of cells (Materials and Methods). Each sample represents 5,000 cells. (b) Schematic representation of the mps1 SPB phenotype. (c) The same mps1-1237 cdc37-1 strain was incubated at 38°C for 6 h and examined by EM. These cells display the typical mps1 phenotype: a single SPB, with an enlarged halfbridge (arrow). Bar, 0.2 μm.