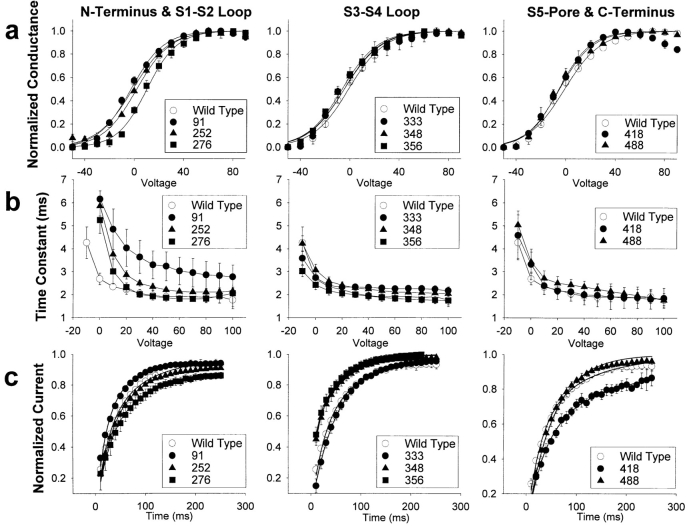
Figure 3.
Electrophysiological properties of the Flag insertion mutants. (a) Conductance voltage relationships were determined by depolarizations from a holding potential of −80 mV to between −80 mV and +150 mV in 10 mV increments. Currents were converted to conductance, as described in Materials and Methods. Conductance values were normalized to the maximum conductance, and the average value is plotted against the depolarizing potential. The curve represents the best fit of a two state Boltzmann equation, as described in Materials and Methods. Symbols represent the means, and error bars indicate the standard deviations for data from four to eight oocytes. (b) Time constants for inactivation were determined by fitting the current traces obtained as in a with a single exponential function, as described in Materials and Methods. The average time constants are plotted against the depolarizing potential. Symbols represent the means, and error bars indicate the standard deviations for data from four to six oocytes. (c) Recovery from inactivation was determined by a 50 mV inactivating pulse for 50 ms, a variable recovery interval from 10 to 250 ms, and a test pulse to +50 mV for 40 ms to assess recovery, as described in Materials and Methods. The maximum current during each test pulse was normalized to the maximum current during the inactivating pulse, and the average values are plotted against the recovery interval. The smooth curve represents a fit of the average data to a double exponential equation, as described in Materials and Methods. Symbols represent the means, and error bars indicate the standard deviations for data from four to eight oocytes.

