
Figure 4.
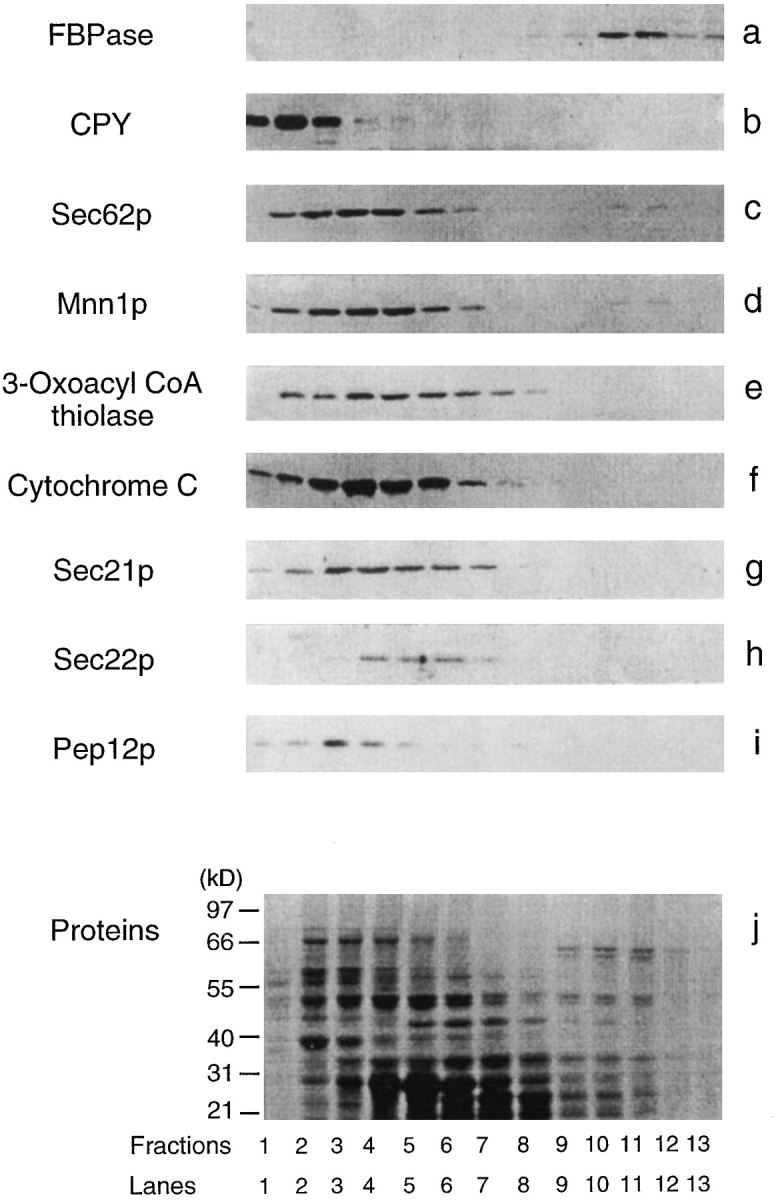
Organelle distribution on the sucrose gradients. Wildtype cells were shifted to glucose for 30 min. Fractions 25–30 from t = 30 min were pooled from the S-1000 columns and resolved on 20–50% sucrose equilibrium gradients. The distributions of various organelles were detected by immunoblotting with antibodies directed against organelle markers described in Fig. 2. Total protein was visualized by staining with Coomassie blue R-250 (j).