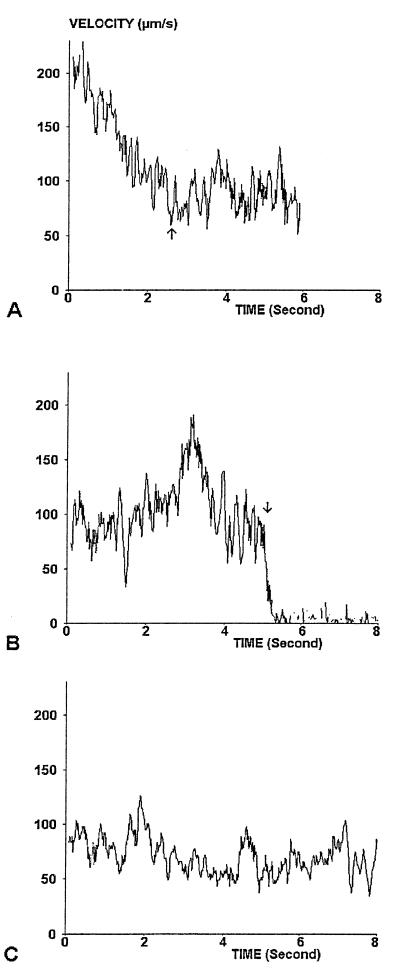
Figure 1.
Sample trajectories. Actual (A and B) or simulated (C) trajectories are shown. (A) The motion of a particle that entered the observation field with high velocity and displayed progressive slowing (until arrow) before displaying velocity fluctuations around a constant value. (B) The motion of a particle that displayed a typical binding event (arrow) resulting in immediate stop. (A) Simulated trajectory that was qualitatively similar to the motion of real particles.

