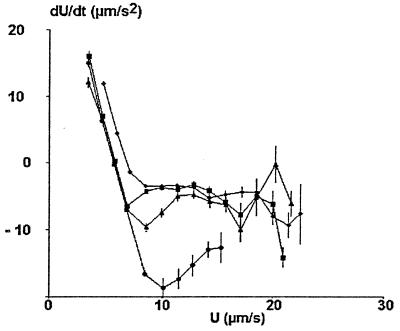
Figure 3.
Velocity dependence of mean particle acceleration (simulated curves). Series of ≈60 simulated trajectories (800 positions each) were generated with a Hamaker constant of 0 (diamonds), 10−22 (squares), 10−21 (triangles), or 10−20 (circles) J and a wall shear rate of 10 s−1. The mean acceleration was determined for 10–20 velocity groups and displayed vs. velocity (vertical bar length is twice the SEM). Remarkable points of the curve were the velocity U0 corresponding to zero value of dU/dt and the first minimum of dU/dt (in the interval [U0, 1.5 U0]). Note that the SEM is fairly low when U is lower than ≈1.5U0. This minimum exhibited a sharp decrease when the Hamaker constant increased.

