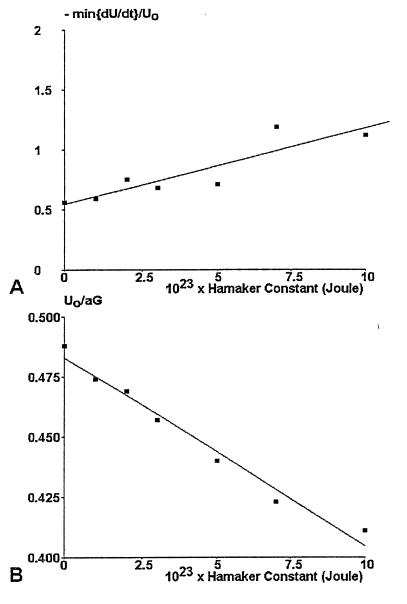
Figure 4.
Use of trajectory analysis to determine the wall shear rate and Hamaker constant. Seven series of simulated trajectories (48,000 positions each) were generated for a constant shear rate of 10 s−1 and different values of the Hamaker constant. The velocity U0 at zero acceleration and the minimum value of d[U/U0] in the velocity interval [U0, 1.5 U0] were determined and plotted vs. Hamaker constant. These curves were used to determine first the Hamaker constant (A) and second the wall shear rate (B).

