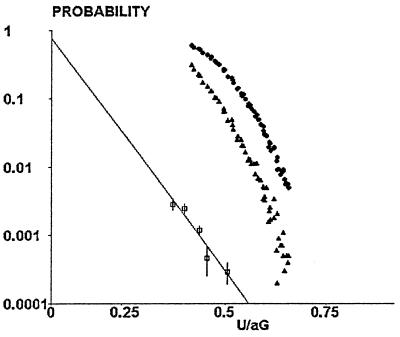
Figure 5.
Determination of the range and rate of association between surface-bound molecules. Simulated curves were used to determine the relationship between particle mean velocity (in a 0.16-s interval) and corrected time passed within binding distance with respect to the chamber floor. Typical curves are shown for 5 nm (triangles) and 40 nm (circles) range. Squares represent experimental values of the binding frequency of cadherin-coated particles moving along cadherin-coated surfaces.

