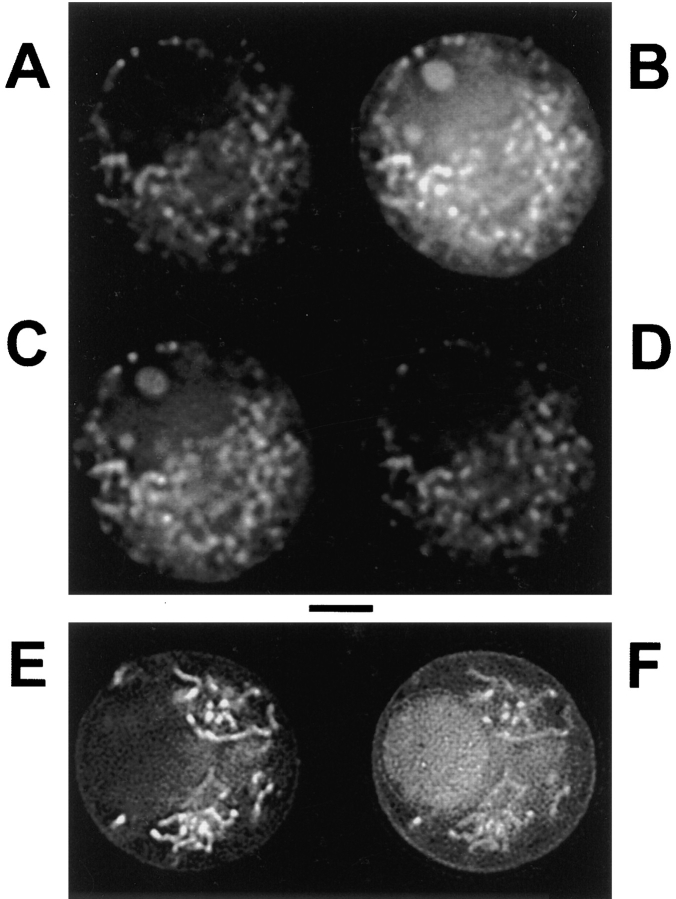
Figure 1.
Rhod-2 images of chromaffin cell responses to depolarization and coimages of rhod-2 with Calcium Green. (A–D) Fluorescence deconvolution images of a single cell after loading with AM ester of rhod-2. Images were collected before, during, ∼4 s after, and ∼1 min after a 10-s, fast local perfusion with a depolarizing (70 mM KCl) medium. (E–F) After coloading with AM esters of rhod-2 and Calcium Green, images were collected from a central plane of a single cell not subjected to stimulus, using excitation and emission filters for rhod-2 in E and then for Calcium Green in F. Scale bar represents 4 μm.

