
Figure 4.
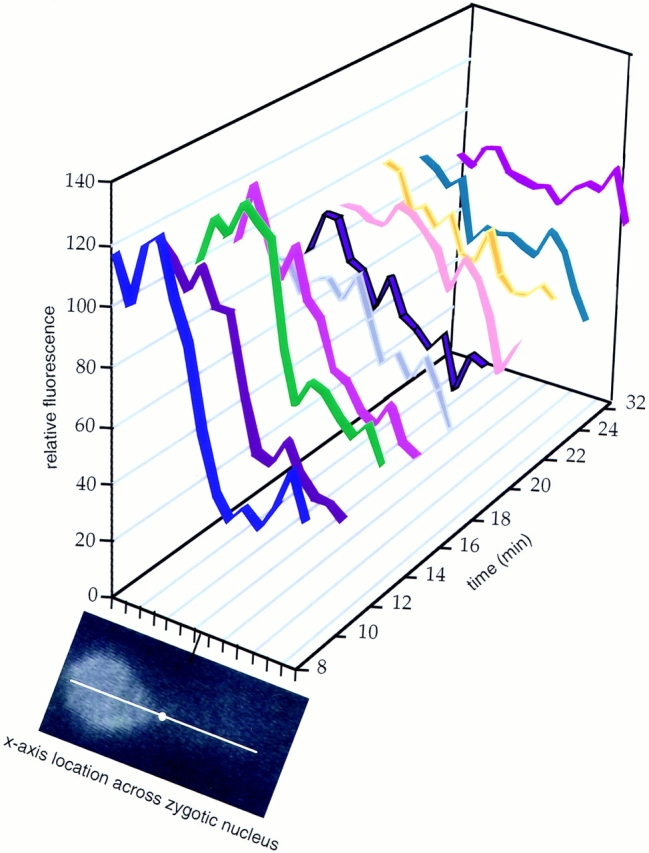
Time course of GFP–Nup49p redistribution in the zygotic nucleus. A representative image is shown from early in the video of the top wild-type zygote in Fig. 3. At each time point during the video (y-axis), a line spanning the donor and recipient nuclear surfaces was designated (shown in white with the dot marking the fusion junction). Distance along the line is graphed on the x-axis. For each line in the respective zygotic nucleus, NIH Image 1.60 was used to quantify the fluorescence intensity at 28 points ∼0.3 μm apart. The fluorescence values of each two sequential measurements along the x-axis were averaged, and the 14 resulting relative fluorescence data points were graphed on the z-axis. The first time point at 8 min in the video (blue ribbon) represents the approximate time of nuclear fusion. Later time points are shown in different colors along the y-axis. Microsoft Excel 4.0 (Seattle, WA) was used to display the graph.