
Figure 2.
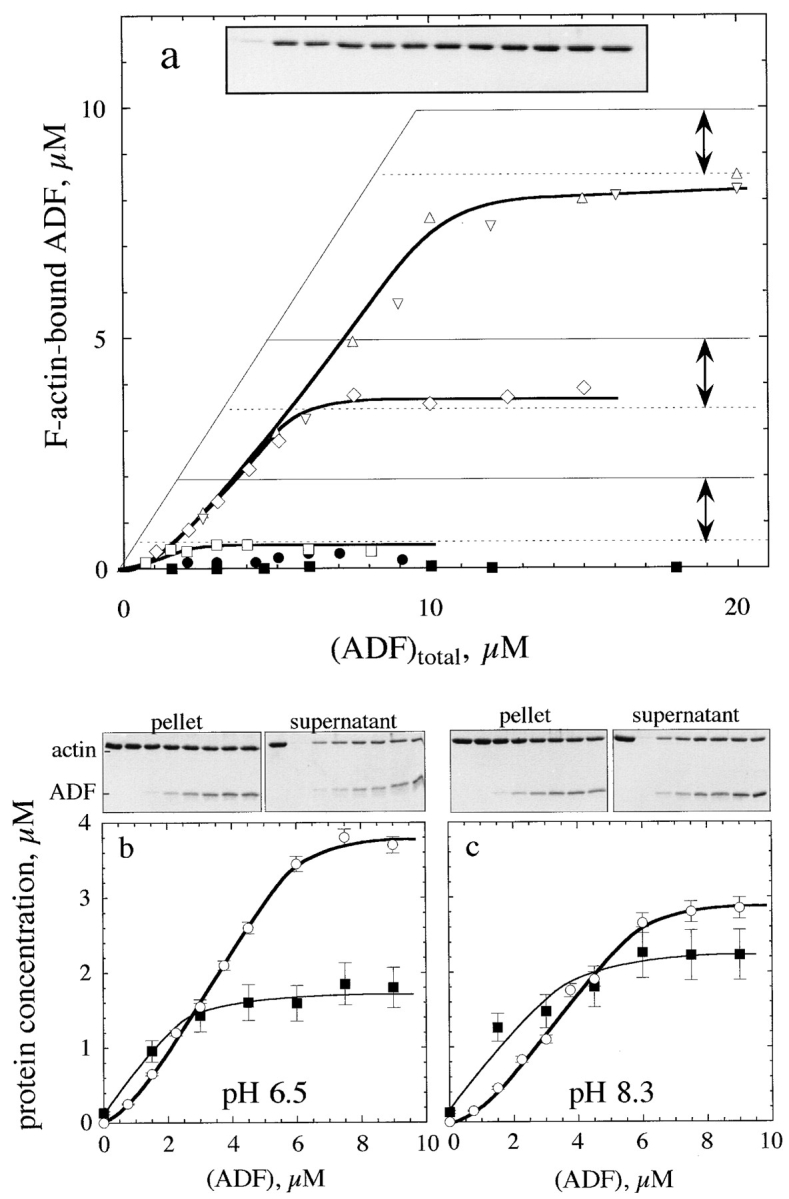
Interaction of ADF1 with F-actin. (a) Sedimentation assay for binding of ADF1 to F-actin. The binding of 35S-labeled ADF to F-actin was measured at the following concentrations of F-actin (μM): □, 2; ⋄, 5; ▵ and ▿, 10. •, 5 μM F-actin, 7.5 μM phalloidin. ▪, 7 μM F-actin-ADP-BeF3. The interval between the two arrows represents the amount of unassembled actin found at steady state in the supernatant of sedimented samples. Thin lines represent the high-affinity titration curves that would be obtained if ADF bound tightly to F-actin exclusively in a 1:1 molar ratio. (Inset) SDS-PAGE pattern of actin in the supernatant of sedimented samples containing 7 μM F-actin and ADF (in μM, left to right): 0, 1, 2, 3, 4, 5, 6, 8, 18, 12, 15, and 17. (b and c) pH dependence of ADF1 interaction with F-actin. SDS-PAGE of the pellets and supernatants of F-actin (5 μM) assembled at pH 6.5 (b) or pH 8.3 (c) in the presence of ADF. Left to right lanes: whole actin (5 μM); samples containing 0, 1.5, 3, 4.5, 6, 7.5, and 9 μM ADF. ▪, densitometered actin bands in the supernatants (in μM); ○, amount of ADF–F-actin, in μM (from 35S radioactivity measurements).